Figures & data
Figure 1. The workflow of GASN is divided into 6 steps. Specifically, (a) is used to predict the genetic characteristics of gene mutation function influence score and the observed FIS, which are fused as the feature vector for constructing a similarity network. (b) Taking gene as an example, the similarity between
and other genes is calculated. (c) The top k-nearest neighbor genes
in the similarity ranking of each gene are selected to form the topology. (d) Taking gene
as an example, the gene similarity network is constructed, and its order is
, the similarity network of all genes is used as the input of convolutional neural network. (e) It shows the 5-layer basic structure of the convolutional neural network used in this paper, including the input layer, convolution layer, pooling layer, full connection layer, and output layer. (f) The gene background distribution is fitted by gamma distribution in the subclass, and the observed FIS is compared with the predicted FIS in the background distribution, to obtain the p value of each gene and select the gene with significant deviation as the driver gene.
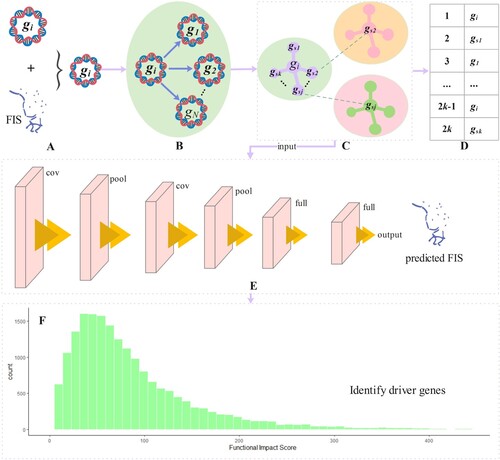
Figure 2. Histogram of gene background distribution in 9 cancer types.
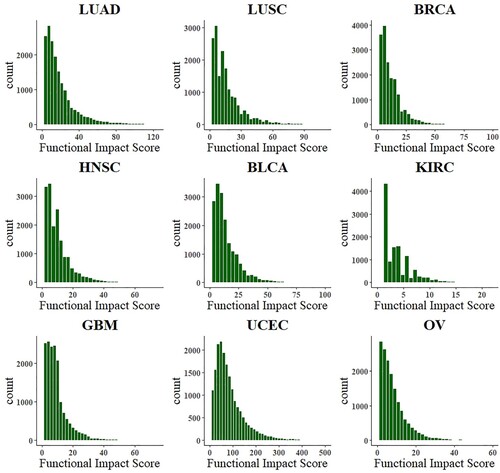
Table 1. 12 genetic characteristics of multimers data sources.
Table 2. Performance indexes of gene similarity network convolution neural network under different k values.
Figure 3. The number of NCG6.0 genes identified by different methods in 10 cancer types.
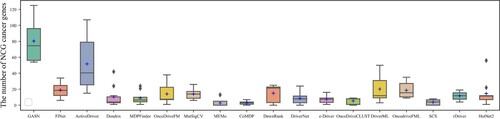
Figure 4. The precision of NCG6.0 genes identified by different methods in 10 cancer types.
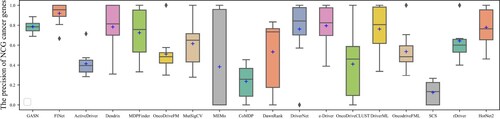
Figure 5. The recall of NCG6.0 genes identified by different methods in 10 cancer types.
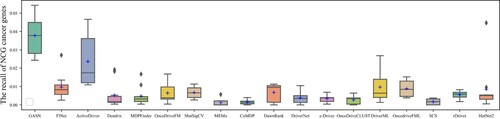
Figure 6. The number of CGC genes identified by different methods in 10 cancer types.
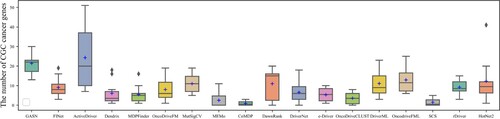
Figure 7. The precision of CGC genes identified by different methods in 10 cancer types.
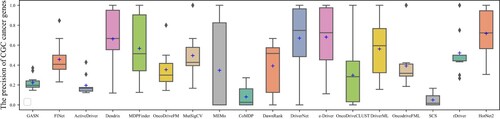
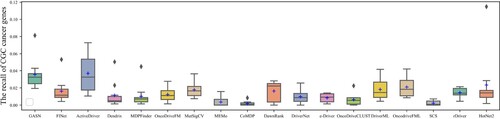
Figure 8. The recall of CGC genes identified by different methods in 10 cancer types.