
Figures & data
Figure 1. Orthogonal projection purifies text features.
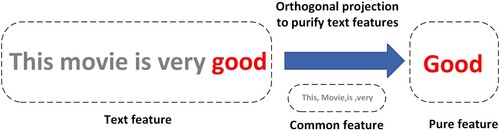
Figure 2. Structure of FP-Net and structure of IAOPM.
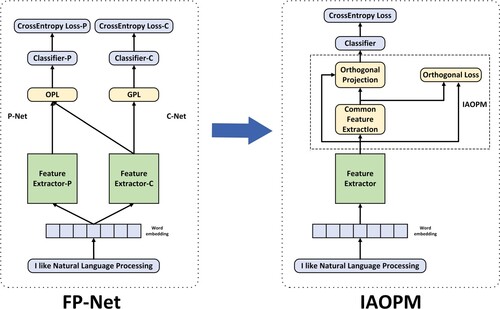
Figure 3. IA generated common features, including Attention Generation and Inverted Attention to Generate Common Features.
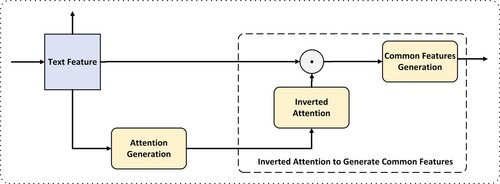
Figure 4. IA obtained low-weight information by resetting weight of high-weight features to 0.
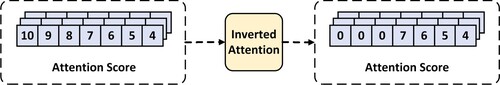
Figure 5. Orthogronal projection in 2D space.
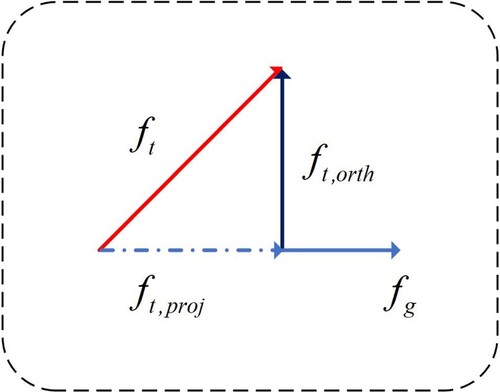
Figure 6. (a): The distribution of common features in 2D space in normal circumstances (b): The distribution of common features generated by IA in 2D space
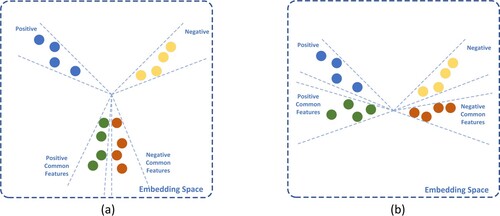
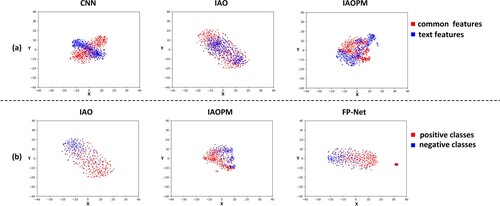
Figure 7. (a): Visualisation of the common features and text features of CNN, IAO, and IAOPM in 2D space. (b): Visualisation of the common features (different classes) of IAO, IAOPM, and FP-Net in 2D space.
Table
Table 1. Parameter settings of feature extractors.
Table 2. Results of IAOPM, Self-Attention and FP-Net for four benchmark datasets.
Table 3. Time overhead table.
Figure 8. The visualisation of common features in 2D and polar coordinate space for IAOPM and FP-Net.
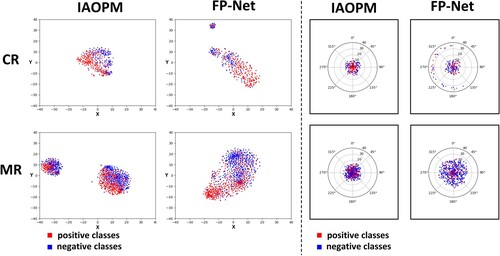
Figure 9. The visualisation of common features in 3D space for IAOPM and FP-Net.
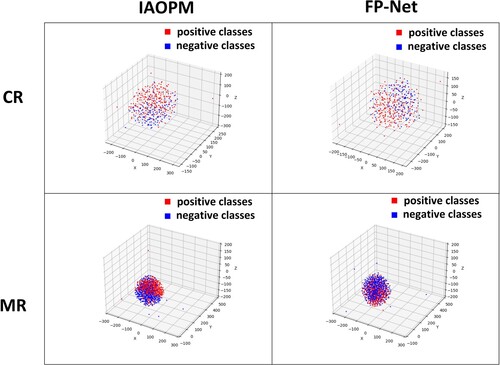
Table 4. Ablation experiments.
Table 5. Hyperparametric experiment.