Figures & data
Figure 1. Lyapunov Exponent of proposed Gauss-logistic map. (With reference to Equation 5; The Gauss map is represented by the first two equations with the colors green and red, whereas the Logistic map is represented by the last three equations with the colors pink, black, and blue.)
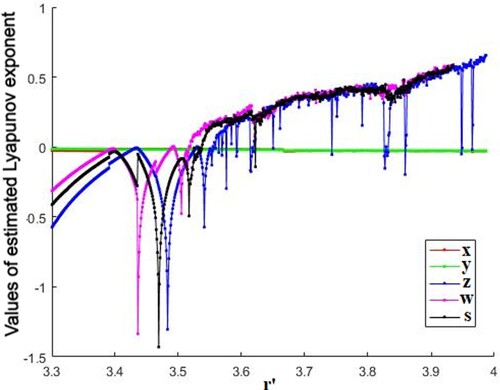
Figure 2. Sensitivity analysis of 4D Lorenz hyperchaotic system.
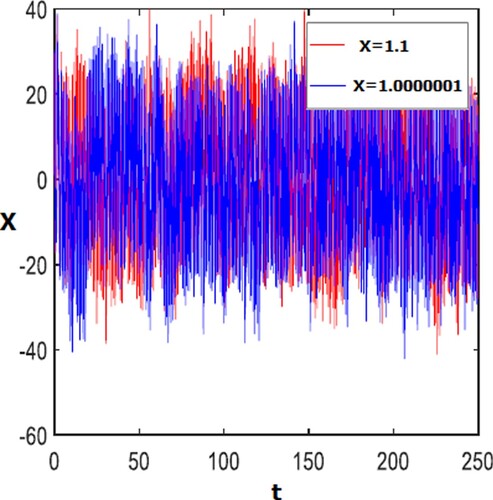
Figure 3. Sensitivity analysis of 5D Gauss-logistic hyperchaotic system.
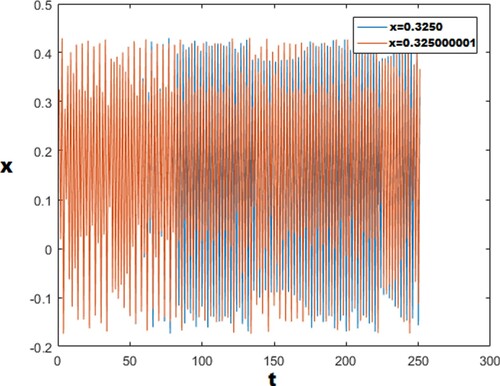
Figure 4. Proposed LGL encryption algorithm.
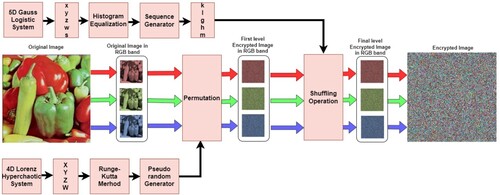
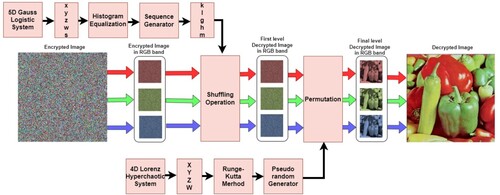
Figure 5. Proposed LGL decryption algorithm.
Table
Table
Table
Table
Figure 6. Original, encrypted, and decrypted colored test images with proposed algorithm.
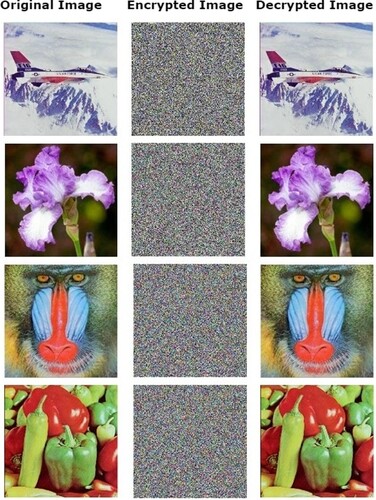
Figure 7. Comparative histogram of HDIEA.
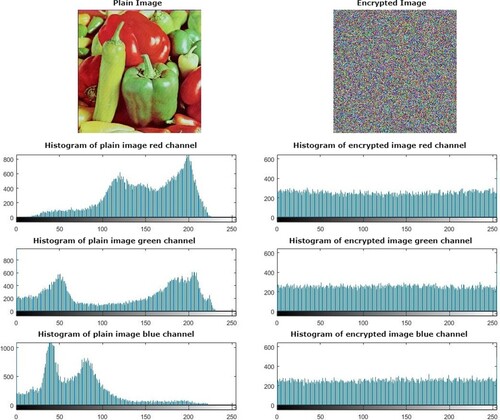
Table 1. Histogram uniformity evaluation by chi-square test.
Figure 8. The pixel distribution of different (RGB) components of pepper original and encrypted image in horizontal, vertical and diagonal directions.
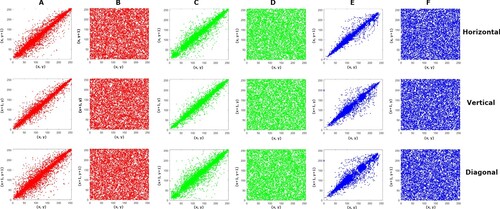
Table 2. Correlation coefficients of original and encrypted test images.
Table 3. Correlation coefficients of colored test images in the RGB components.
Table 4. Comparison of correlation coefficients of colored test images.
Table 5. Comparison of correlation coefficients of colored test images in the R G B components.
Table 6. Information entropy results for the proposed algorithm on different test images.
Table 7. Comparison of Information entropy with different literature.
Table 8. Local Entropy results for the proposed algorithm on different test images.
Table 9. NPCR AND UACI values of different size test images.
Table 10. Comparison among the suggested algorithm and the algorithms in literature based on NPCR and UACI.
Table 11. Comparison of keyspace in different literatures.
Figure 9. Key sensitivity analysis of the proposed algorithm on test images.
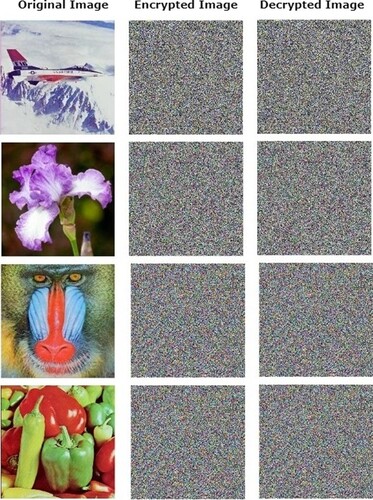
Figure 10. Key sensitivity analysis for encrypted pepper image with a slight change in one of the secret keys.
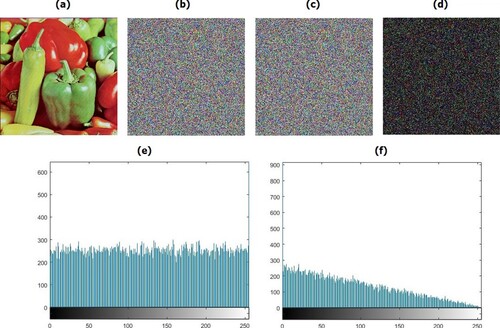
Table 12. CDRs estimation as a result of changing secret keys for encryptions.
Table 13. Randomness test for the 5D Gauss logistic hyperchaotic system's sequences.
Table 14. Test scores for the proposed algorithm such as PSNR, SSIM, MSE.
Figure 11. Noise attack on Pepper image.
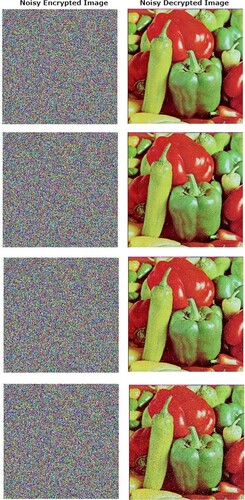
Table 15. Noise attacks with different intensities.
Figure 12. Cropping attack on Pepper image.
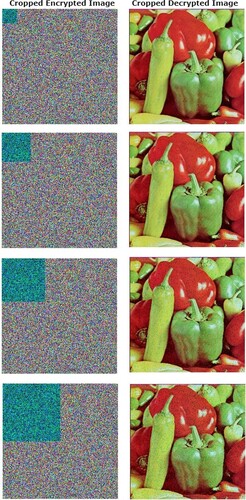
Table 16. Cropping attacks with different data loss pixel areas.
Table 17. Computational time for the proposed algorithm on different test images.
Table 18. Comparison of computational time and Speed analysis of encryption process in different literatures.
Figure 13. Original, encrypted, and decrypted Iris image.
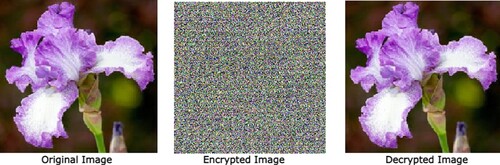
Figure 14. Iris image classification before and after encryption.
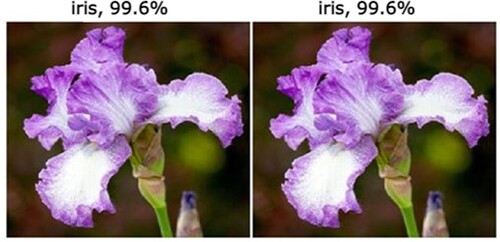
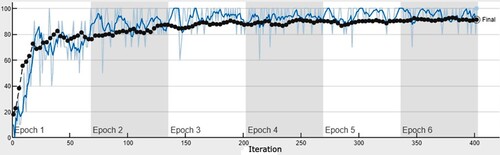
Figure 15. Accuracy versus iteration graph for the Iris image.