
Figures & data
Figure 1. The architecture of our model. It is an end-to-end architecture, which can be divided into four modules, including basic network, region proposal, boundary regressor and classifier. A sentence ‘She is born in New York’ is given as an example to show the flow path of recognising named entities. This example is introduced as follows in detail.
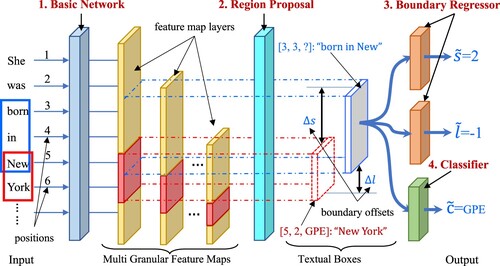
Table 1. Distribution of different intervals.
Table 2. Distribution of different intervals.
Table 3. Evaluation in the English Corpus.
Table 4. Performance of Boundary Regression.
Table 5. Ablation Study on the ACE2005 corpus.
Table 6. Performance on Region Proposals.
Table 7. Performance on Single and Double Enumeration.
Figure 2. Performance on Parallel Granularities.
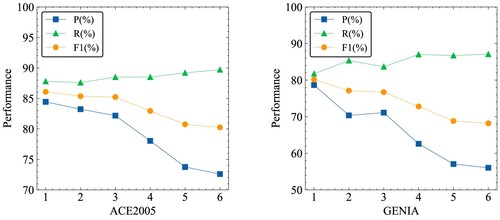
Figure 3. Performance on Stacked Granularities.
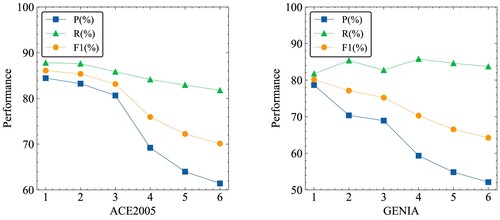
Figure 4. Performance on Multi-granularities.
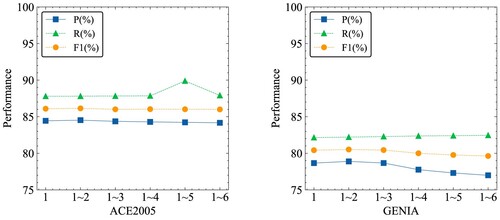
Table 8. Evaluated on the CONLL2003 and OntoNote 5.0 Corpora.
Table 9. Influence of Region Proposal on the CONLL2003 and OntoNote 5.0 Corpora.
Table 10. Complexity Ratio Between Different Region Proposals.
Table 11. The Number of Model Parameter.