Figures & data
Figure 1. Data-sharing mHealth system with conventional CP-ABE.
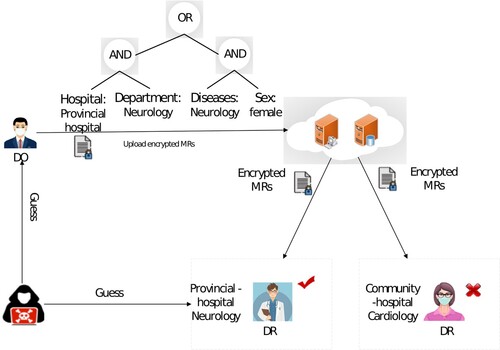
Figure 2. Blockchain structure.
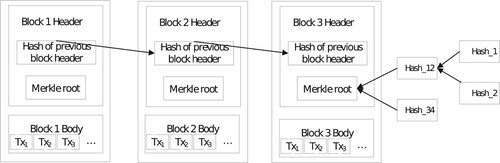
Figure 3. System model.
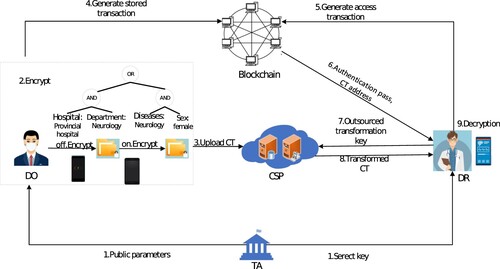
Table 1. Function comparison.
Table 2. Notations and Meaning.
Table 3. A comparative result in computing overhead.
Table 4. Running time for each operation (MS).
Figure 4. The average time cost of: (a) Computation overhead in Online keyGen; (b) Computation overhead in Online encryption; (c) Computation overhead in authentication and (d) Computation overhead in user decryption.
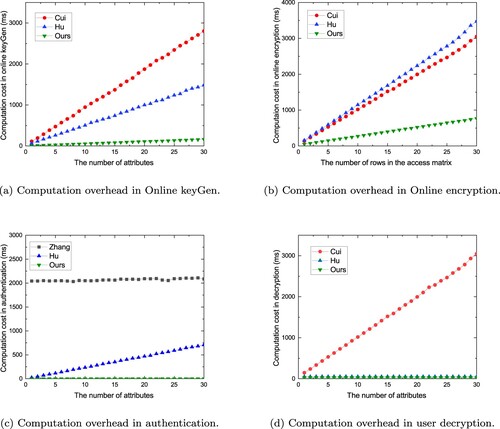
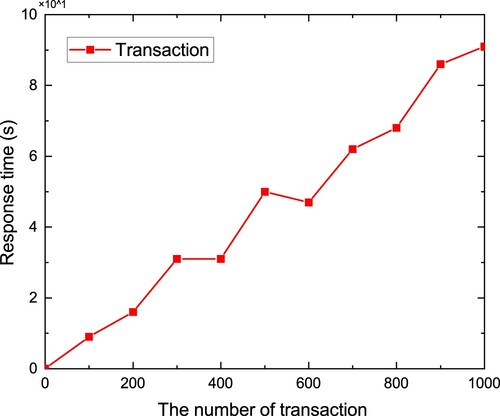
Figure 5. The response time of transaction.