Figures & data
Table 1. Literature review list.
Table 2. Construction and installation equipment details.
Figure 1. Deployment tasks of electrical resources (Schematic representation of the resource allocation process).
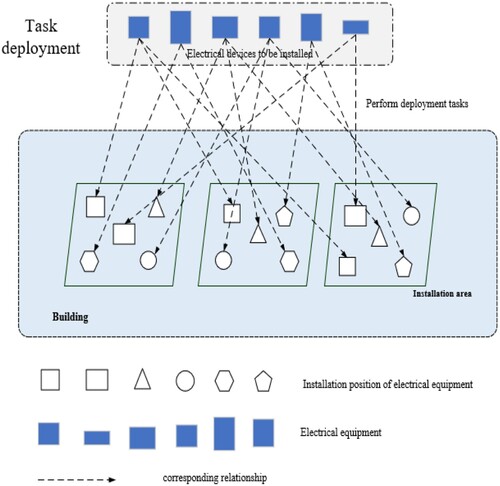
Table 3. Proficiency of different workers.
Table 4. Task volume in construction area.
Table 5. Arrangement sequence of some workers.
Table 6. Task volume in construction area.
Table 7. Arrangement sequence of some workers.
Figure 2. Iterative curve under different parameters. (a) 100 times. (b) 300 times. (c) 500 times. (d) 1000 times.
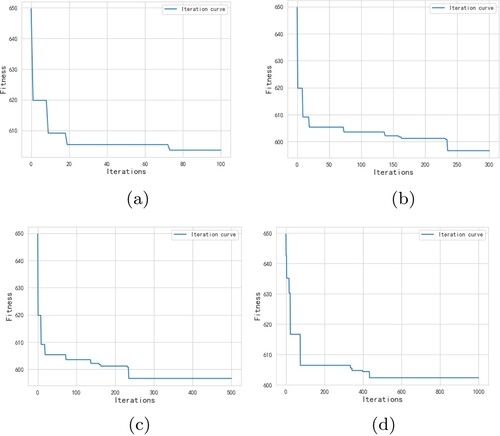
Figure 3. Construction scheme comparison experiment(Comparison of performance differences presented by different solutions in the construction process). (a) Construction time of different experimental schemes. (b) Comparison of minimum construction hours.
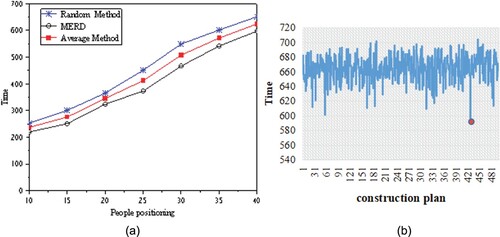
Figure 4. Performance curve of resource allocation under different task loads.
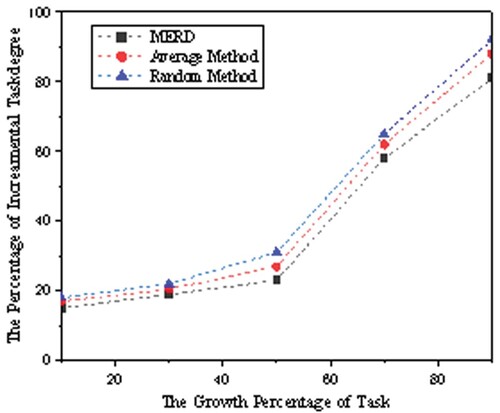
Figure 5. Cost comparison curves under different ranking relationships.
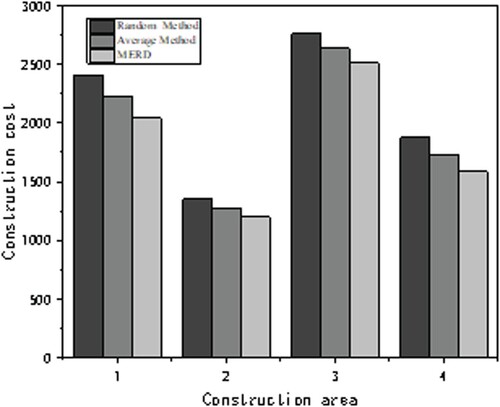
Figure 6. Time complexity comparison curve.
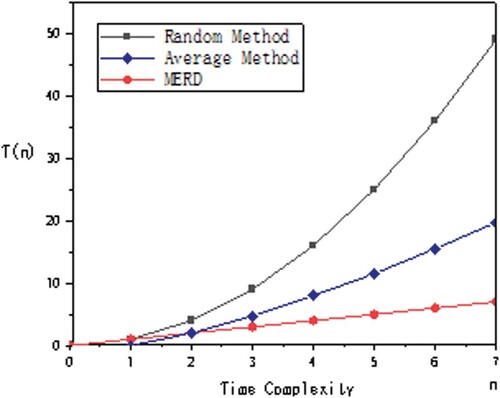
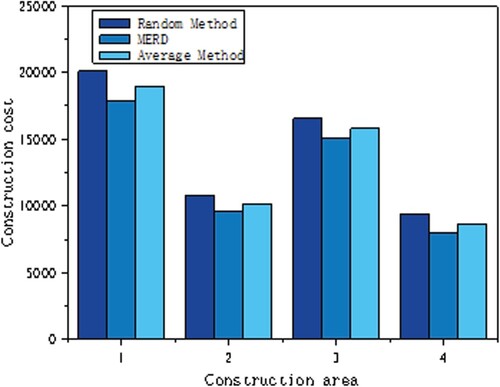
Figure 7. Construction cost under different schemes(Cost differences presented by different solutions in the construction process).