
Figures & data
Figure 1. Representation of ontology and knowledge graph.(a) Example of ABox and TBox of an Ontology. (b) Knowledge graph view from COVID-19 Data.
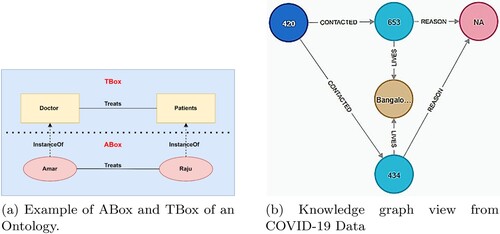
Table 1. BERT model for healthcare domain.
Table 2. COVID-19 corpora description.
Table 3. Dataset and ontology descriptions.
Figure 2. Data pre-processing technique.
Figure 3. Semantic data curation.
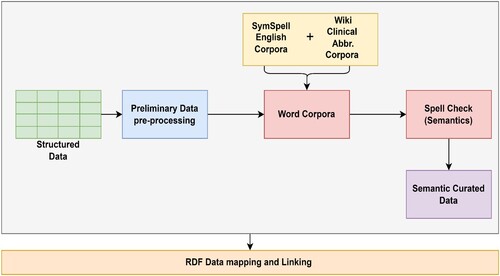
Figure 4. Semantic interestingness framework using BERT.
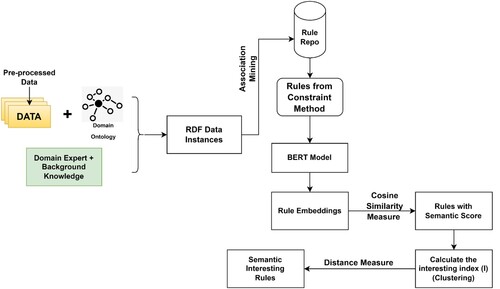
Figure 5. Comparison of traditional and OCA mining.
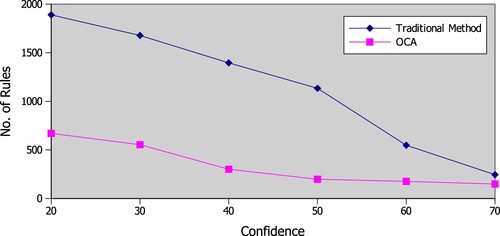
Table 4. Items from the constraint file.
Table 5. Few semantic association rules from COKPME and KATrace dataset.
Table 6. Interesting entities of the rules with different confidence values.
Table 7. Comparative analysis of rules I.
Table 8. Comparative analysis of rules II.
Figure 6. Transformer-based rule processing.
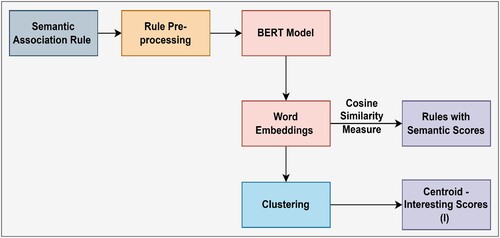
Table 9. Rules from cluster centroid-CovidBERT.
Table 10. Rules from cluster centroid – BioClinicalBERT.
Table 11. Rules from CovidBERT with semantic scores.
Table 12. Rules from BioClinicalBERT with semantic scores.
Table 13. Semantic rules with absolute distance measure using CovidBERT for Cluster 0, 1 and 2.
Table 14. Semantic rules with absolute distance measure using CovidBERT for cluster 3 and 4.
Table 15. Semantic rules with absolute distance measure using BioClinicalBERT for cluster 0, 1 and 2.
Table 16. Semantic rules with absolute distance measure using BioClinicalBERT for cluster 3 and 4.
Table 17. Chi-square test for rule significance on sample rules.
Table 18. Evaluation scale range.
Table 19. Domain expert evaluation summary.