Figures & data
Table 1. An example of event logs.
Table 2. The comparisons of different process variants discovery methods.
Figure 1. A reference model and its process variant. (a) The mined reference model for log
using inductive mining method (b) A process variant model
from
by personalised operations.
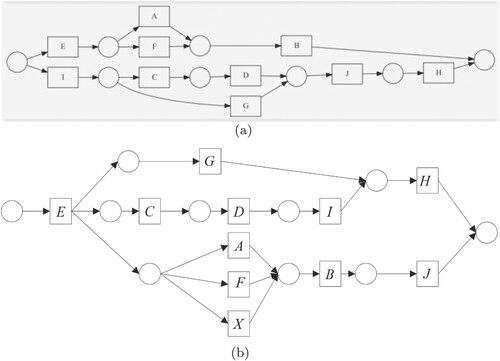
Figure 2. The mined model of log L through inductive mining.
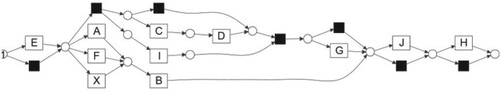
Figure 3. Two clusters deduced from log L through tracing clustering method (Xu & Liu, Citation2019). (a) The first cluster model through tracing clustering method (b) The second cluster model through tracing clustering method.
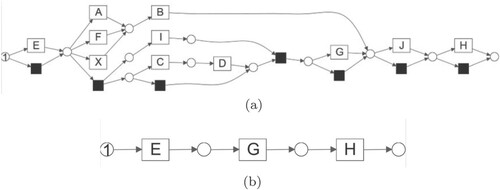
Table 3. Experimental results comparison among different methods for log .
Table 4. An example of event log L to illustrate context log.
Figure 4. The context tree corresponding to the event logs in Table .
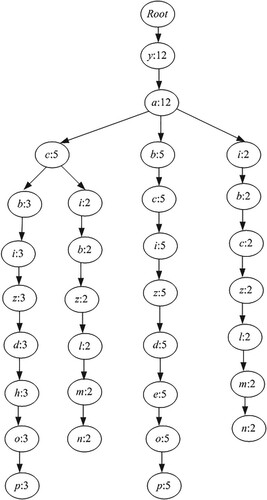
Table 5. Event logs of credit disposal processes.
Table 6. Frequency of activities.
Table 7. kth-strict order relationships of nodes b and h.
Table 8. Activity alphabet with node b of length k.
Table 9. Activity alphabet with node h length k.
Table 10. Context logs for nodes b and h.
Table 11. Weighted frequency cosine similarity calculation results.
Figure 5. Context tree of .
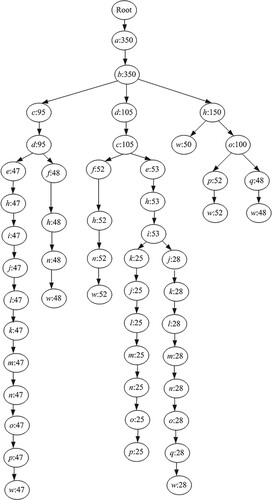
Figure 6. Process variants (a), (b), (c), (d) found in the event log. (a) Housing loan process (b) Student loan process (c) Commercial loan process (d) Small loan process.
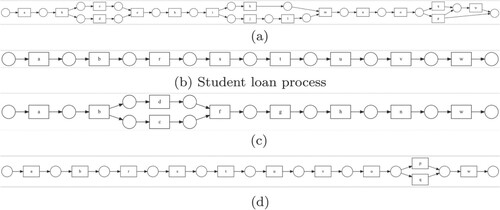
Table 12. Comparison of process variants discovery methods.
Table 13. Holistic information of datasets.
Table 14. Performance indicators comparisons with (Chan et al., Citation2014).
Table 15. Performance indicators comparisons with (Xu & Liu, Citation2019).
Figure 7. Fitness and precision comparisons based on daset1 and dataset2. (a) Performance comparisons with (Chan et al., Citation2014) (b) Performance comparisons with (Xu & Liu, Citation2019).
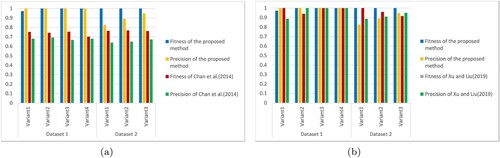
Table 16. Comparisons among different methods for log .
Table 17. Comparisons among different methods for BPIC 2015 log.
Figure 8. Fitness and precision comparisons for event logs with different variant distributions. (a) fitness of (b) precision of
(c) fitness of BPIC2015 (d) precision of BPIC2015.
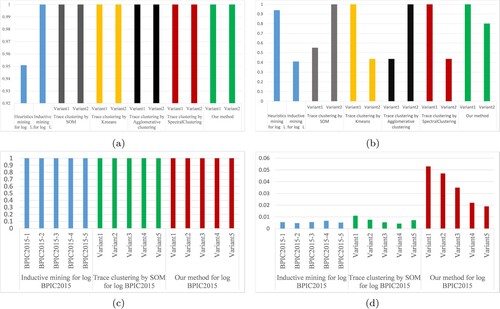
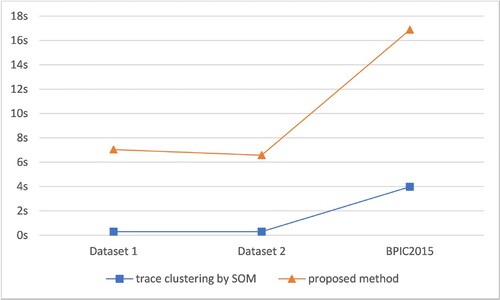
Figure 9. Execution time of different methods.