Figures & data
Table 1. Summary of existing poisoning attack defense schemes in FL.
Table 2. Notations.
Figure 1. The PBFT consensus protocol.
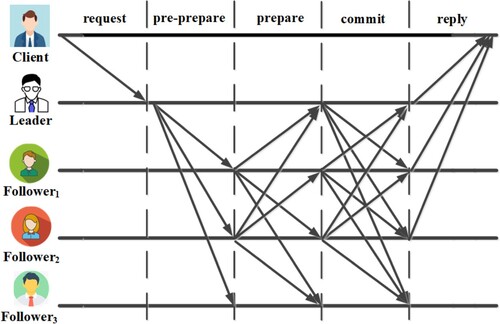
Figure 2. The process of DBSCAN. (a) First step (b) Second step.
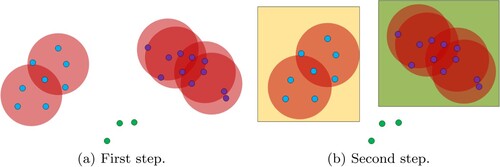
Figure 3. The architecture of GAN.
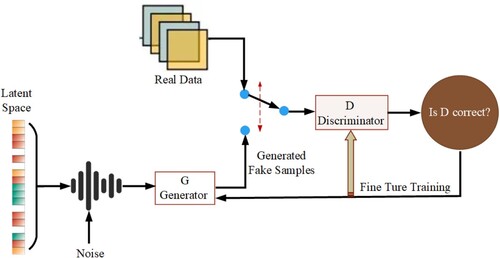
Figure 4. System model.
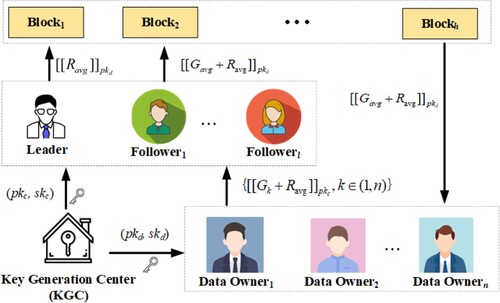
Figure 5. The process of FedG2L.
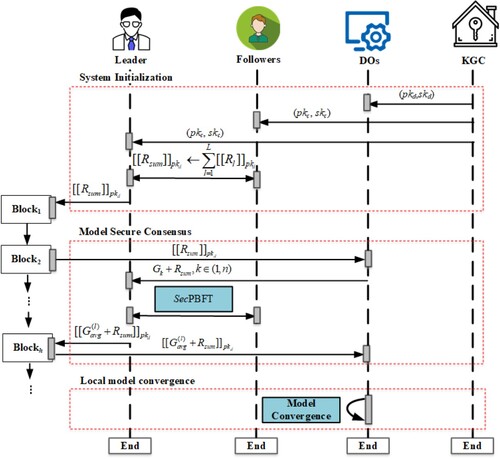
Figure 6. Comparison of accuracy with different epochs and byzantine percentage. (a) Epochs. (b) Byzantine percentage.
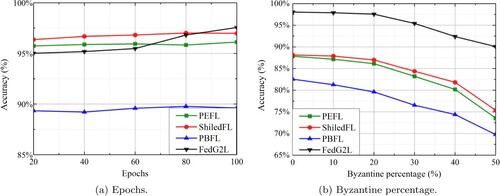
Figure 7. The ASR with different Byzantine percentages on 2 datasets. (a) Performance on MNIST dataset. (b) Performance on EMNIST dataset.
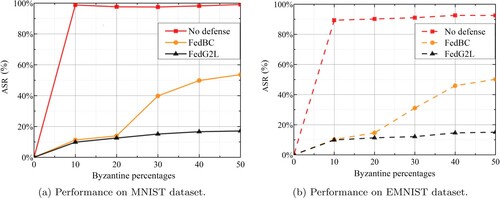
Figure 8. Comparison of accuracy with different schemes.
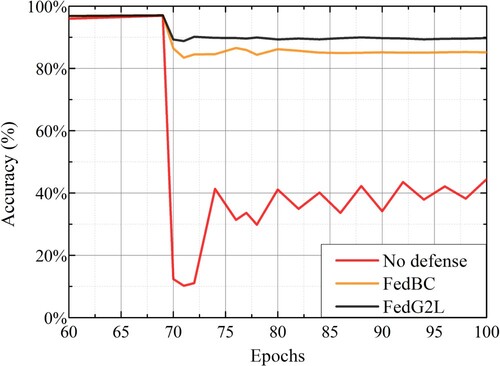
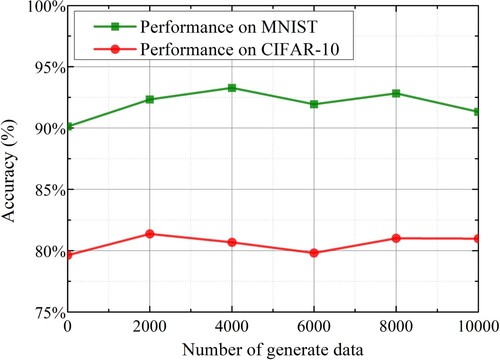
Figure 9. Comparison of accuracy with different numbers of generated data on different datasets.