
Figures & data
Figure 1. The architecture of models.
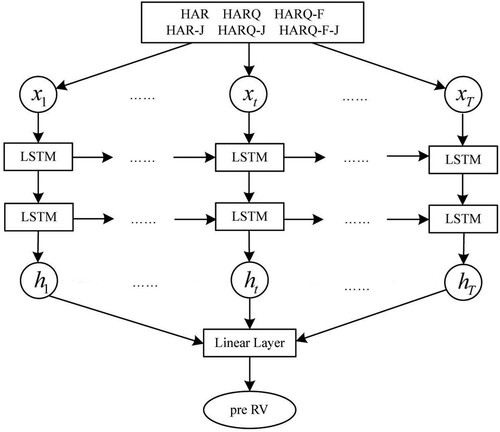
Table 1. Descriptive statistics of return rate of stock data of six different industries.
Figure 2. 5-min logarithmic Income Fluctuation Trend.
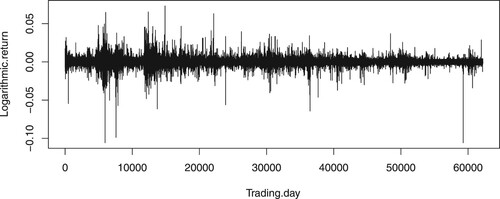
Figure 3. Realised volatility trend.
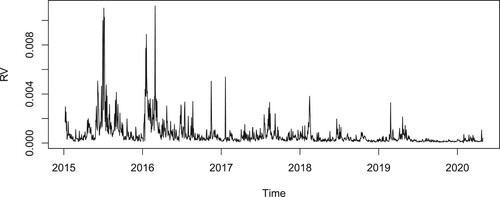
Table 2. Estimation results of various volatility model parameters of Shanxi coking coal sample population.
Table 3. Parameter estimation results of various volatility models of Angang stock sample population.
Table 4. Prediction effect of volatility model under each model.
Table 5. Prediction effect of volatility based on different machine learning models.
Table 6. Prediction effect of mixed models based on LSTM.
Table 7. MCS test results of prediction results of traditional models with different volatility.
Table 8. MCS test results of prediction results of traditional models of the last four volatility.
Table 9. MCS test results based on prediction results of different volatility models under LSTM.
Table 10. MCS test results based on the prediction results of the last four volatility models under LSTM.