
Figures & data
Figure 1. Framework of our stacking model.
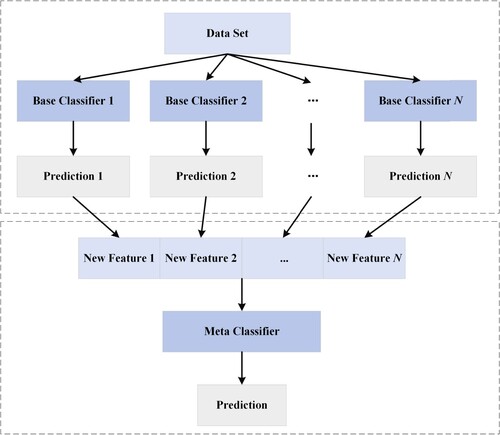
Figure 2. The first layer of a single model using 5-fold cross-validation.
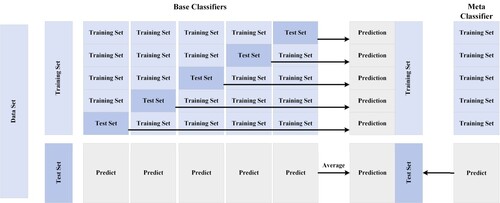
Figure 3. The framework of RF.
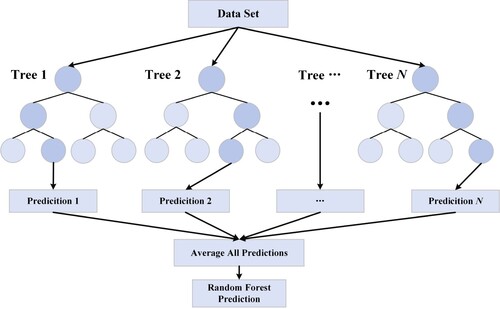
Figure 4. Neuronal structure diagram of the perceptual machine.
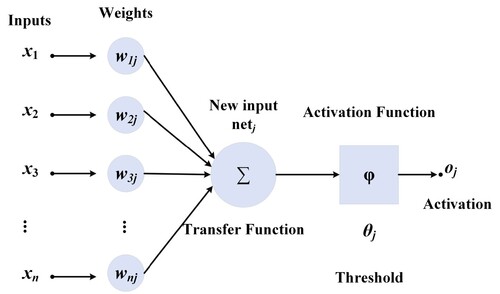
Figure 5. Structure of a multilayer neural network with only one hidden layer.
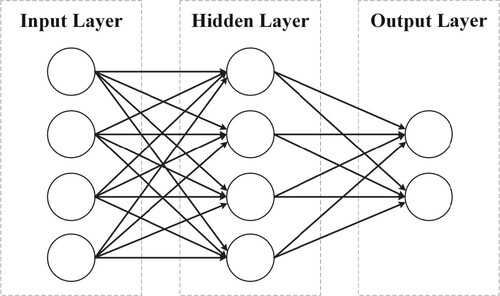
Figure 6. When K takes values of 3 and 5, the samples belong to different classifications.
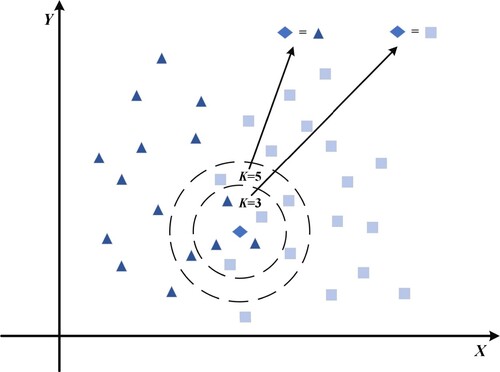
Figure 7. Schematic diagram for finding the maximum interval hyperplane.
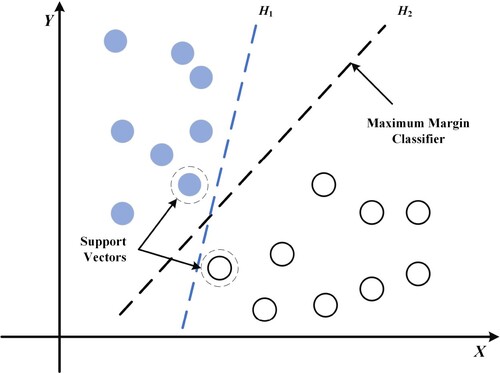
Figure 8. Schematic diagram of the feature generation process.
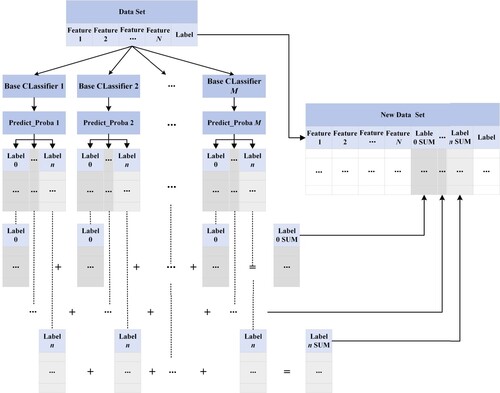
Figure 9. Schematic diagram of the experimental model frame structure.
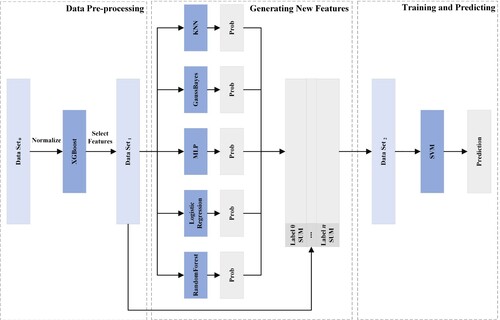
Table 1. Data set information where #Instances is the number of instances and #Features is the number of features.
Table 2. Data set information after preprocessing.
Table 3. Experimental results from the RF, LR, GNB, MLP, KNN, SVM, Stacking, and FESVM using the first eight data sets in Table .
Table 4. Experimental results from the RF, LR, GNB, MLP, KNN, SVM, Stacking, and FESVM using the ninth to sixteenth data sets in Table .
Table 5. Experimental results from the RF, LR, GNB, MLP, KNN, SVM, Stacking, and FESVM using the last four data sets in Table .
Figure 10. Comparison of the average performance results of each model based on the 20 data sets.
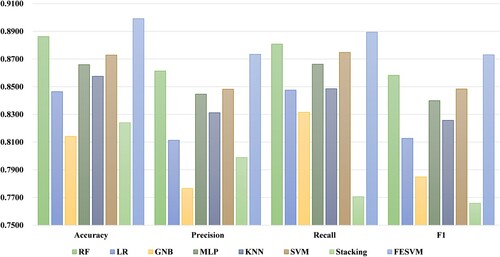
Figure 11. Critical difference diagram of Accuracy based on the 20 data sets.
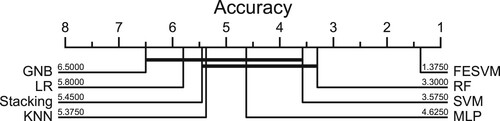
Figure 12. Critical difference diagram of F1-Score based on the 20 data sets.
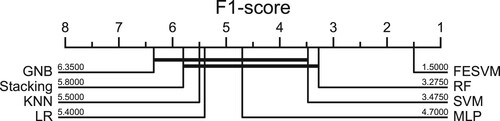
Table 6. Statistical test results for the RF, LR, GNB, MLP, KNN, SVM, Stacking, and FESVM in terms of accuracy (p-values less than 0.05 are highlighted in bold).
Table 7. Statistical test results for the RF, LR, GNB, MLP, KNN, SVM, Stacking, and FESVM in terms of F1-Score (p-values less than 0.05 are highlighted in bold).
Table 8. Comparison of computation time based on different input features used for the 20 data sets using our proposed FESVM where t1 is the computation time using all features, t2 is the computation time using generated features, t3 is the computation time using feature selection, and t4 is the computation time using the features from the feature generation and feature selection.