
Figures & data
Figure 1. Architecture of distributed (a) and hierarchical (b) WSNs.
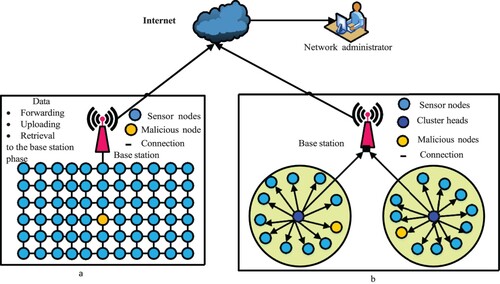
Figure 2. Wireless sensor networks model with clustering Nodes for data aggregation to the sink node.
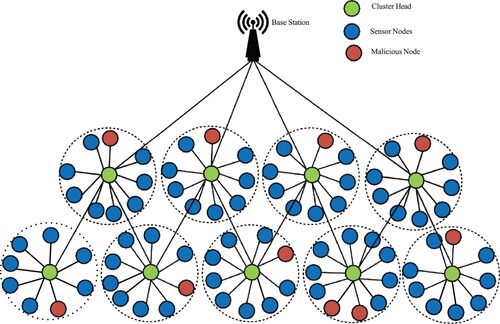
Figure 3. The organisation and framework of the proposed work.
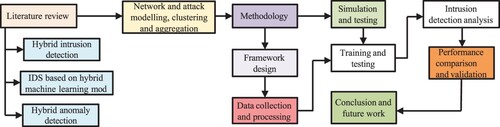
Figure 4. hybrid intrusion detection model with anomaly detector and rule-based detector.
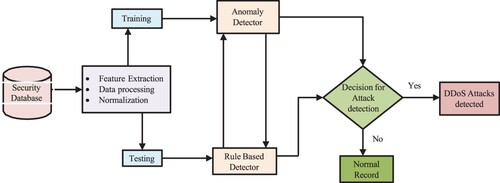
Figure 5. Block diagram for advanced and hybrid intrusion detection system.
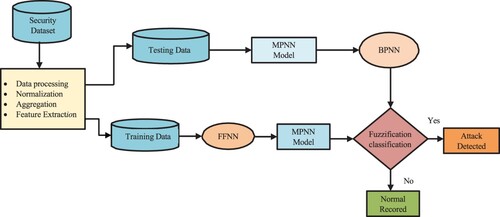
Figure 6. Block diagram of an intrusion detection system using the flow-based technique.
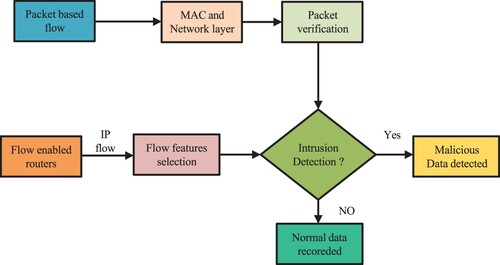
Figure 7. Hierarchical hybrid intrusion detection technique in wireless sensor networks using three phases of attack detection.
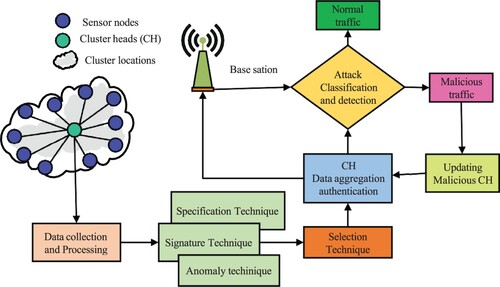
Figure 8. Illustration of data aggregation and clustering in WSNs.
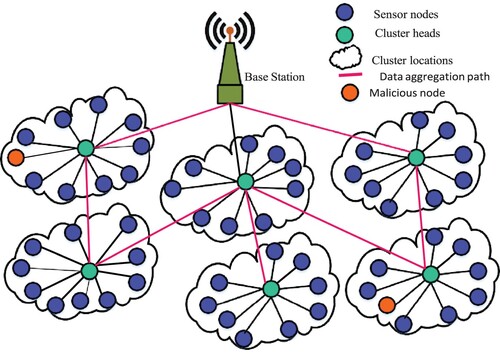
Figure 9. Hybrid PSO-PNN technique for attack classification and detection.
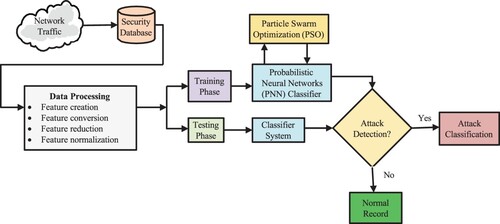
Table 1. Summary of different hybrid techniques from previous works.
Figure 10. Hierarchical topology and configuration model for secure wireless sensor networks.
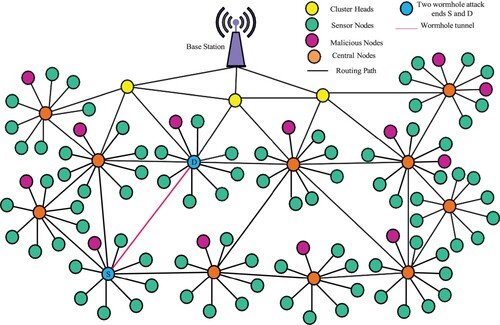
Figure 11. Jamming (a) and Sinkhole (b) attacks at the physical and network layers. (a) Jamming attacks and (b) Sink hole attacks
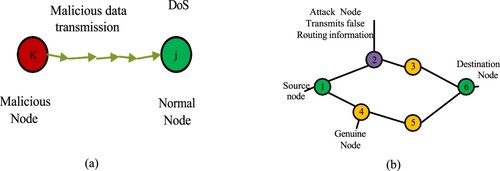
Table 2. Frequency distribution of various attack classes in the NSL-KDD with training and testing samples for testing performance (Li et al., Citation2018).
Table 3. Provides a detailed technical description of the four types of attacks in the dataset.
Table 4. Frequency distribution of attacks in the dataset.
Table 5. The dataset's statistical distribution, based on a subset of its attributes.
Table 6. Structure of the dataset with classifications of assaults.
Figure 12. Framework for advanced hybrid intrusion detection system (AHIDS) Block diagram using attack detection and classification Model.
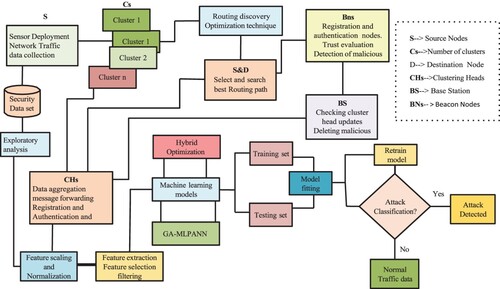
Figure 13. Illustration of flow chart diagram based on various phases of the proposed system.
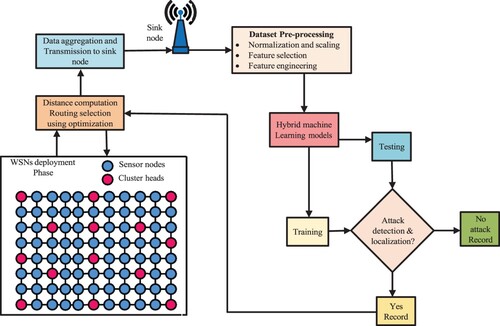
Figure 14. Data pre-processing, training and testing for model evaluation framework using benchmark datasets.
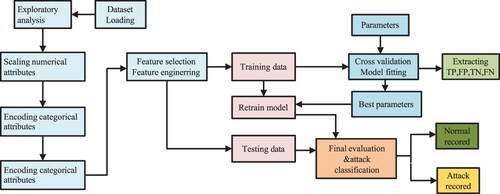
Figure 15. Selection of important feature technique using NSL-KDD benchmark dataset.
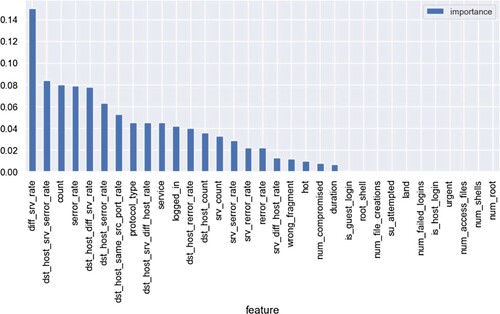
Figure 16. Block diagram of random forest operation for training and testing benchmark dataset.
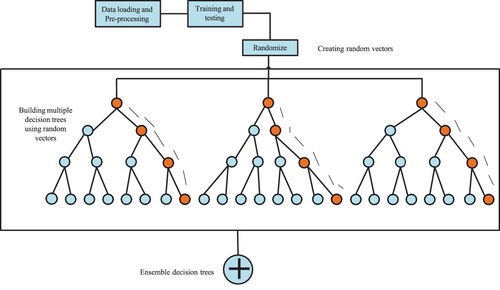
Table 7. WSN configuration of simulation setting.
Figure 17. wireless sensor network deployment and routing discovery for analysing energy consumption and time elapsed. (a) Dynamic network deployment. (b) Routing discovery and feature extraction. (C) Energy consumed for nodes with time and (d) Time elapsed for each node.
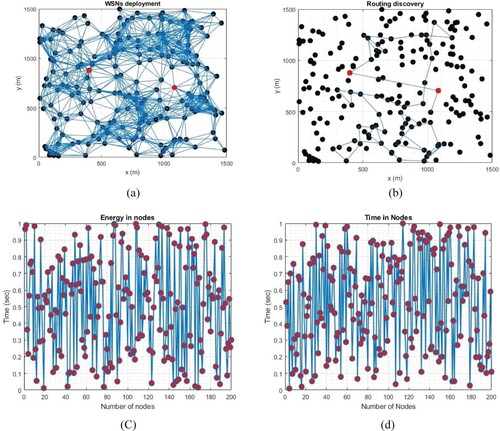
Figure 18. The proposed system's performance evaluation using hybrid GA-ANN takes 100 samples and varying the number of epochs. (a) Histogram with 300 instances. (b) Histogram with 300 instances. (c) Best performance ate epoch of 7 and (d) Best performance at the epoch of 100.
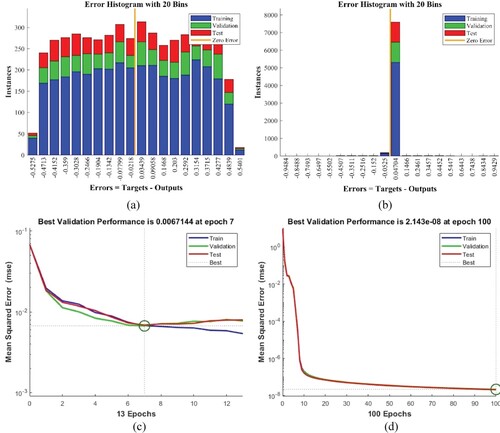
Table 8. Evaluation of hybrid machine learning models on standard datasets.
Table 9. Comparison of various hybrid ML models using NSL-KDD dataset for attack detection and classification.
Figure 19. Performance comparison of various machine learning models using NSL-KDD. (a) RF-based comparative analysis and (b) DT-based comparative analysis
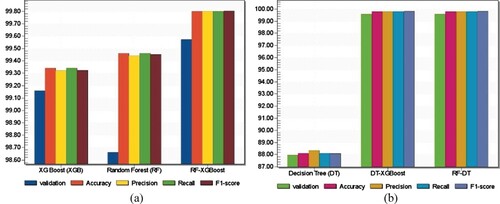
Figure 20. Performance comparison of the proposed scheme-based hybrid machine learning techniques using benchmark datasets. (a) Comparison based on UNSW_NB15 and (b) Comparison-based CICIDS2017
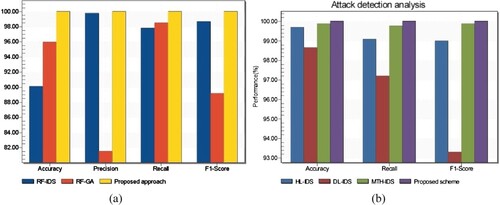
Figure 21. Performance comparison of the proposed technique with other previous works. (a) Comparative analysis of the proposed scheme and (b) Comparative analysis based on recall
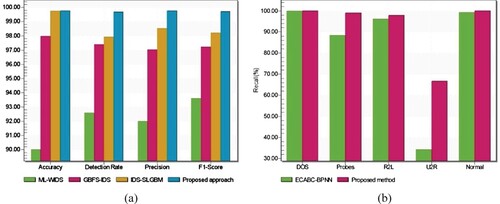
Figure 22. Examining the proposed system's performance of similar works using standard benchmarks. (a) Comparison of the proposed system with recent works and (b) AUC-based performance comparison using the UNSW-NB15 benchmark dataset.
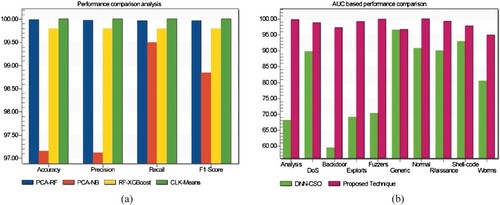
Table 10. Performance evaluation of the proposed system using the NSL-KDD benchmark dataset.