Figures & data
Figure 1. Dual motor multi-speed coupling drive system.
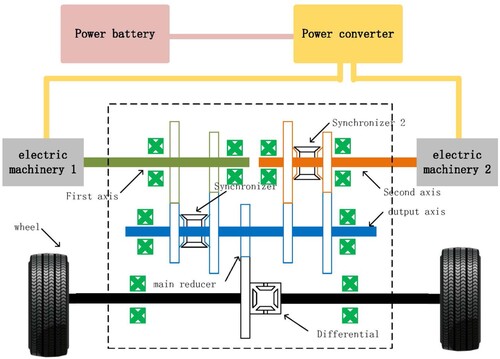
Table 1. Operating status table of motor and synchroniser in each mode.
Table 2. Overall vehicle parameters.
Figure 2. External characteristics of the drive system.
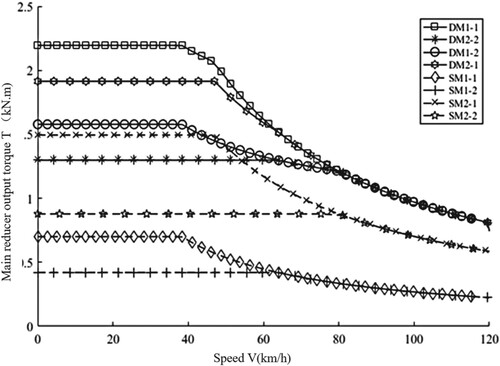
Figure 3. MAP diagram of economic motor and power motor. (a) Economic motor MAP diagram (b) Power motor MAP diagram.
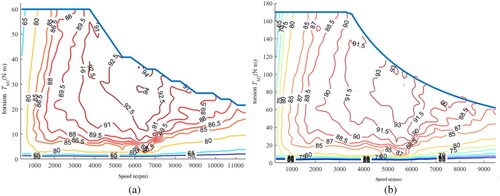
Figure 4. Power consumption in different modesr. (a) Low-speed high-torque coupling case (b) High-speed high-torque coupling case.
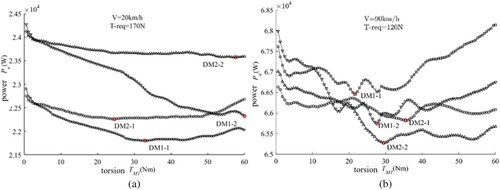
Figure 5. Power consumption at different torques. (a) Power consumption in DM1-1 mode (b) Power consumption in DM2-2 mode.
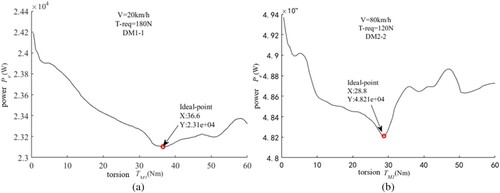
Figure 6. Drive mode division. (a) 8 types of drive mode division (b) 6 types of drive mode division.
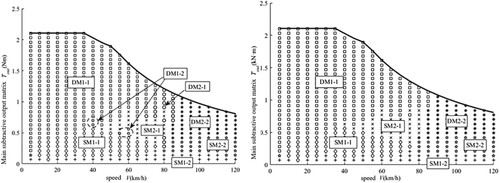
Figure 7. DM1-1 mode switching DM2-2 mode flow.
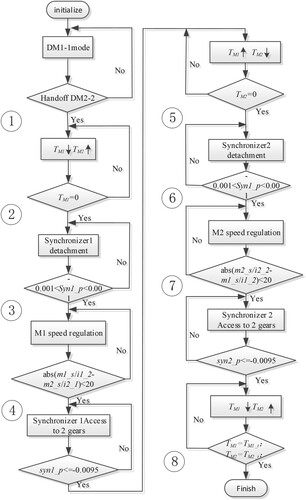
Figure 8. SM1-1 mode switch SM2-1 mode flow chart.
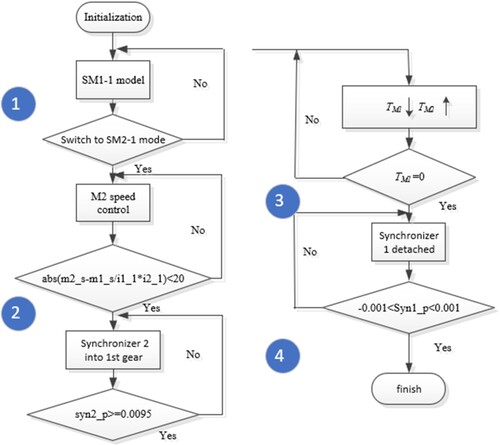
Figure 9. AMESim and MATLAB joint simulation model. (a) AMESim Dual Motor Multi-Shift System Physical Model (b) Simulink control model for dual motor multi-speed system.
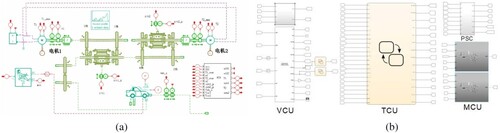
Figure 10. Cycle working condition and SOC variation graph. (a) NEDC cycle work following situation (b) UDDS cycle work following situation (c) 10–15 Circulating conditions follow (d) Comparison of the change of SOC in single cycle working condition.
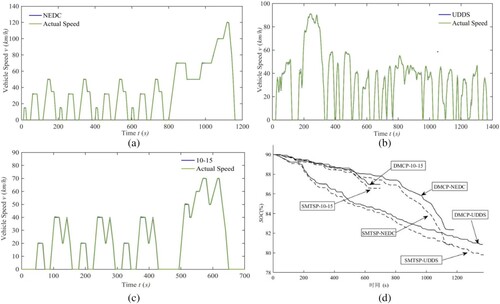
Figure 11. UDDS acceleration section M1, M2 actual operation. (a) M1 Workpoint Distribution (b) M2 work point distribution.
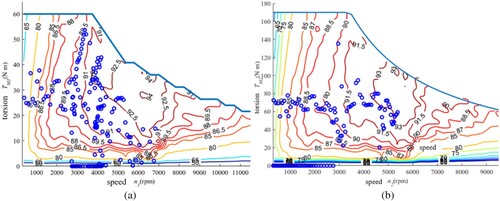
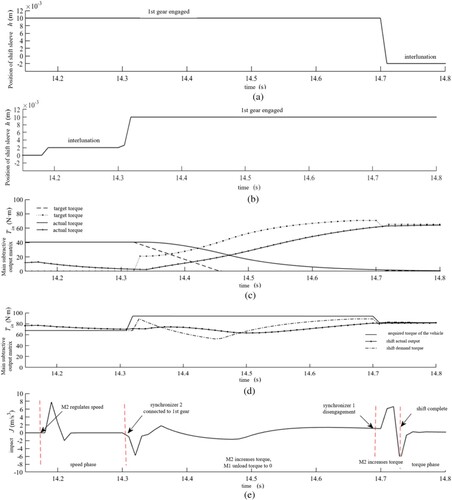
Figure 12. DM1-1 mode switching DM2-2 mode simulation results. (a) Synchronizer 1 binding sleeve position (b) Synchronizer 2 binding sleeve position (c) M1, M2 torque following situation (d) Output torque during mode switching (e) Impact degree during mode switching.
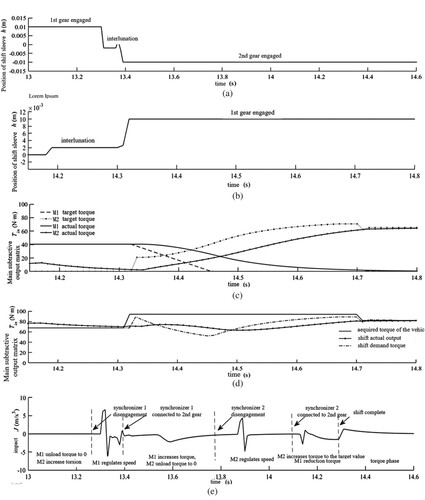
Figure 13. SM1-1 mode switching SM2-1 mode simulation results. (a) Synchronizer 1 binding sleeve position (b) Synchronizer 2 binding sleeve position (c) M1, M2 torque following situation (d) Output torque during mode switching (e) Change in impact degree during mode switching.