Figures & data
Figure 1. A simple illustration of model comparison. (a) Existing mapping-based CDR methods learn personalised mapping functions only considering the user's interactions. (b) The proposed NIPT-CDR considers the user's interactions, together with neighbour users' interactions when learning personalised mapping functions.
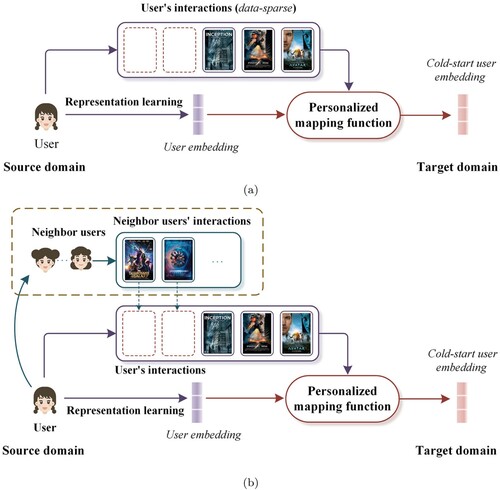
Table 1. Summary of notations.
Figure 2. An illustrative figure of the NIPT-CDR framework.
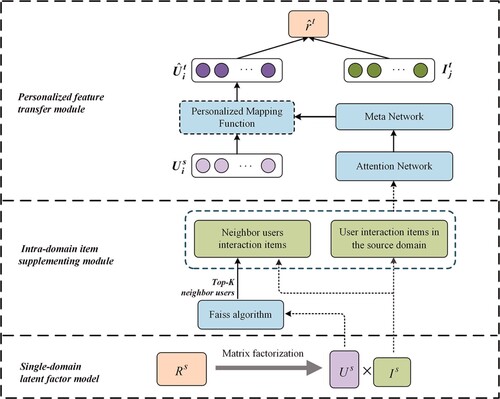
Figure 3. Intra-domain item supplementing module process.
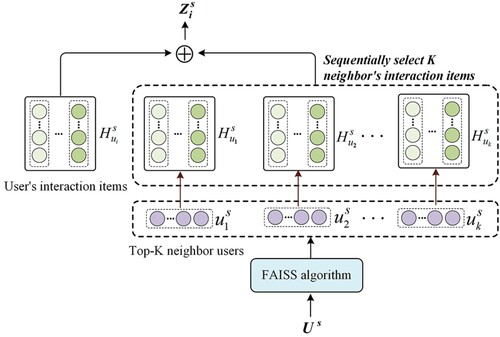
Figure 4. Attention weight calculation process.
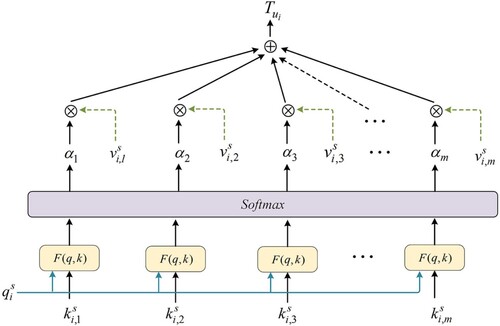
Table 2. Statistics of different cross-domain scenarios on the Amazon dataset.
Table 3. The comparison of the baselines and our method.
Table 4. Comparison of the model NIPT-CDR with other models in terms of the MAE.
Table 5. Comparison of the model NIPT-CDR with other models in terms of the RMSE.
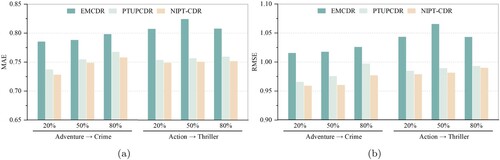
Figure 5. Based on the MF model, the NIPT-CDR compares with EMCDR and PTUPCDR. In (a), we employ MAE metric to evaluate the model's performance, and in (b), the metric is RMSE.
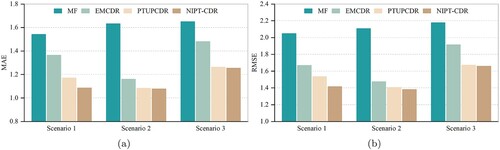
Figure 6. Based on the GMF model, the NIPT-CDR compares with EMCDR and PTUPCDR. In (a), we employ MAE metric to evaluate the model's performance, and in (b), the metric is RMSE.
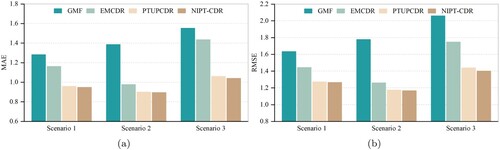
Figure 7. The influence of changing the total number m of interaction items on different cross-domain scenarios in NIPT-CDR. (a) the change curve of the MAE metric and (b) the change curve of the RMSE metric.
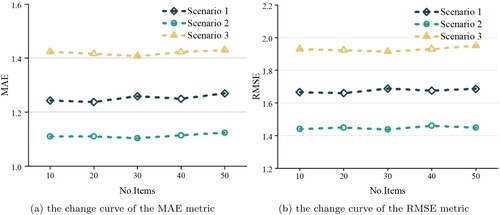
Table 6. The comparison results of ablations studies on three cross-domain scenarios.
Figure 8. F1-score experimental results graph.
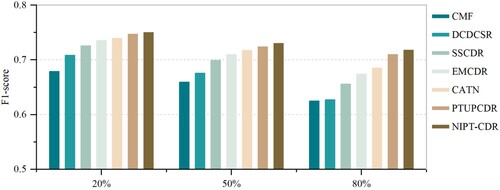
Table 7. Statistics of different cross-domain scenarios on the Movielens-25M dataset.
Figure 9. Comparison results on the Movielens-25M dataset. In (a), we employ the MAE metric to evaluate the model's performance, and in (b), the metric is RMSE.