
Figures & data
Figure 1. Experimental environment. (a) Sketch of the pond. (b) The actual pond.
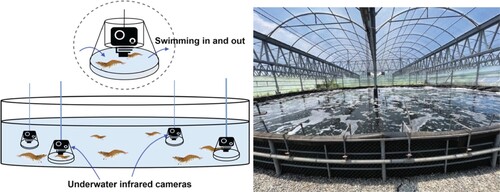
Figure 2. Overall process flow of the proposed method.
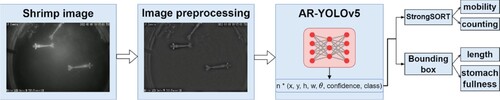
Figure 3. Network architecture of AR-YOLOv5.
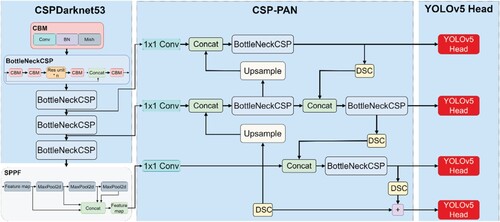
Figure 4. Training process of AR-YOLOv5.
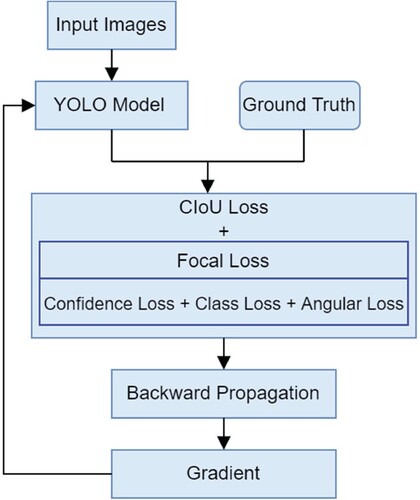
Figure 5. The side length definition.
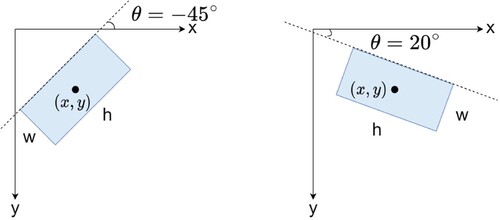
Figure 6. Comparison of the size estimation methods between regular YOLOv5 and the proposed method in the overlapping shrimps. (a) Regular YOLOv5. (b)(c) Regular YOLOv5 failed to estimate size by segmentation. (d) Our angle detection-based size estimation result.
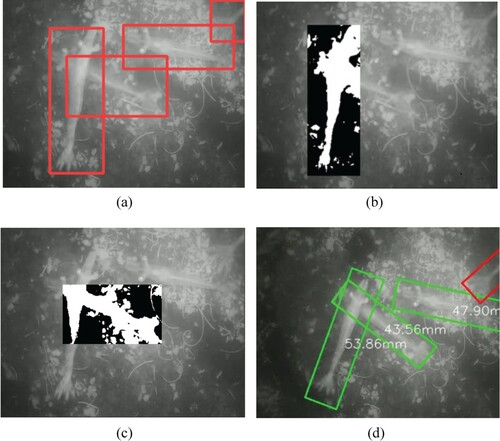
Table 1. Degree of stomach fullness mapping to Full/Empty.
Figure 7. Inner bounding box and Outer bounding box of shrimp were used to calculate the stomach fullness levels.
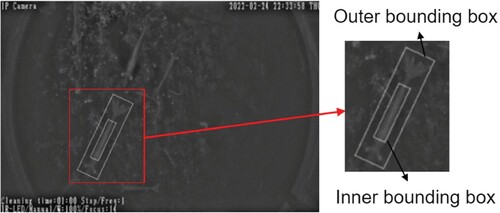
Figure 8. Highlight of the shrimp’s digestive tract segmented using Otsu’s thresholding method.
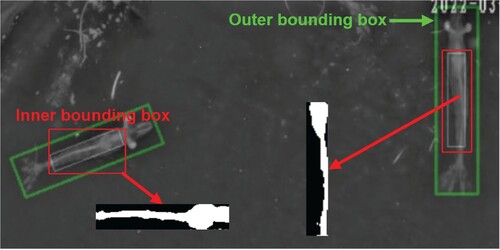
Figure 9. Loss function value curve: Comparison of the Loss for five different AR-YOLOv5 models on the training set.
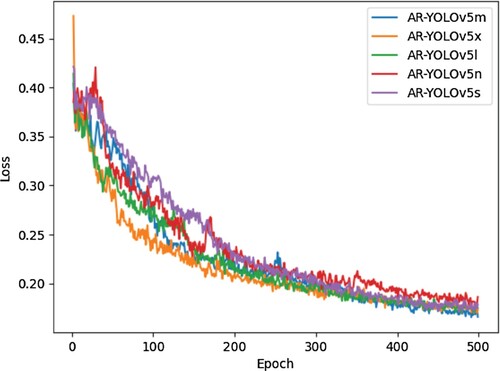
Figure 10. PR curve: Performance comparison of the five different AR-YOLOv5 models on the testing set.
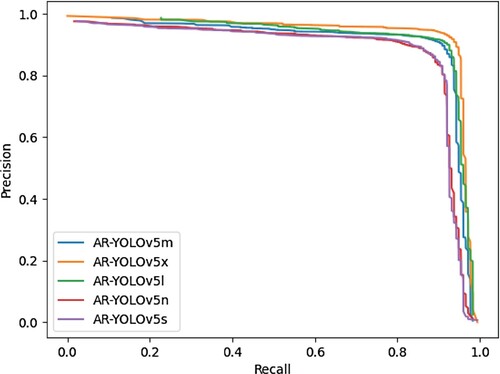
Table 2. Comparison of different models with data preprocessing.
Table 3. Comparison of different models without data preprocessing.
Figure 11. A four-months growth Shrimps length estimation and its error percentage.
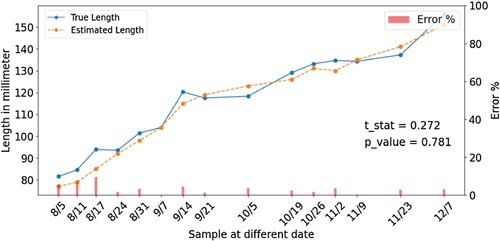
Table 4. Absolute measurement error and error percentage of shrimp’s quantity.
Figure 12. Example of stomach fullness levels. Top row: Stomach fullness level 12.5%. Middle row: 12.5%
Stomach fullness level
50.0%. Bottom row: Stomach fullness level
50.0%.
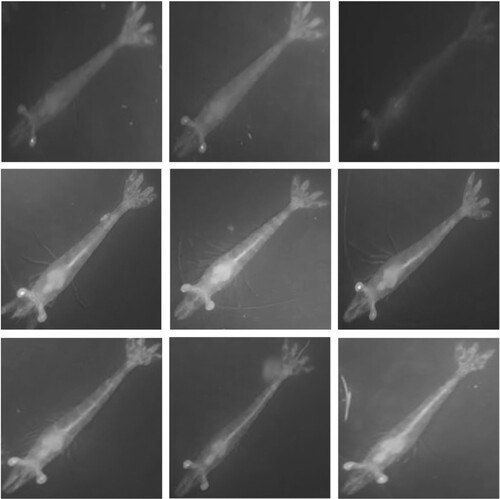
Table 5. Evaluation metric results of two different methods.