
Figures & data
Figure 1. Illustration of IC model diffusion, with initial activated nodes S0 = a, b. The blue colour is the seed node in the activated state. In each round, a node in the activation state activates a neighbouring node with probability p (each edge has a propagation probability p).
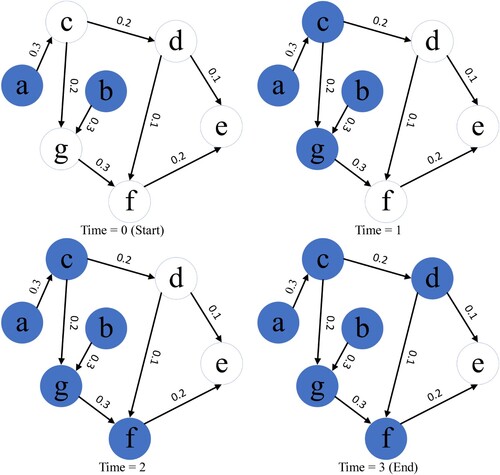
Figure 2. Performance trends on the SF network.
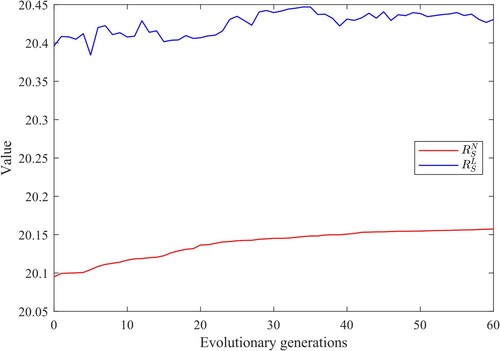
Figure 3. Performance trends on the WS network.
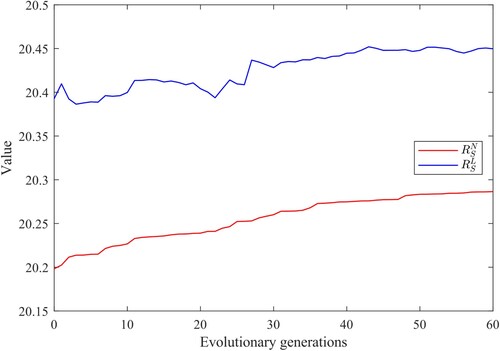
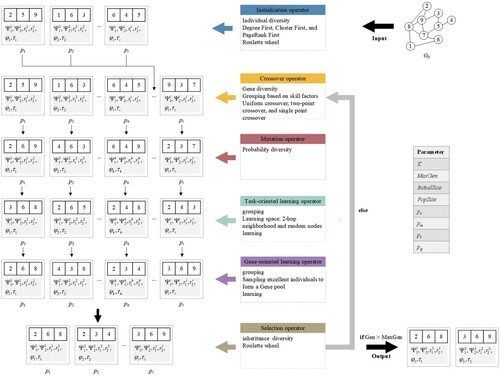
Figure 4. An intuitive framework of DMFEA. A network containing nine nodes is taken as input and two tasks ( and
) are processed. The algorithm consists of six parts: including initialisation, crossover, mutation, task-oriented learning, gene-oriented learning, and selection. Guided by the two performance metrics and the best information of
and
, strong seeds are expected to be the output results.
Table
Table
Table 1 The values of the seeds obtained by different algorithms when
is the optimisation task.
Table 2 The values of the seeds obtained by different algorithms when
is the optimisation task.
Figure 5. Convergence analysis of DMFEA with other single-objective optimisation methods using SF network as an example with seed size K = 20. (a) Convergence curves of different algorithms when is taken as the optimisation task. (b) Convergence curves of different algorithms when
is taken as the optimisation task.
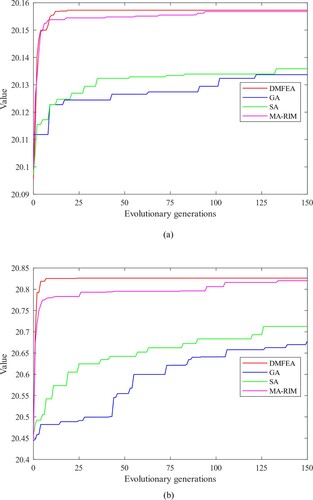
Figure 6. Convergence analysis of DMFEA with other multitasking optimisation methods using SF network (N = 200) as an example with seed size K = 20. (a) Convergence curves of different algorithms when is used as the optimisation task (b) Convergence curves of different algorithms when
is used as the optimisation task.
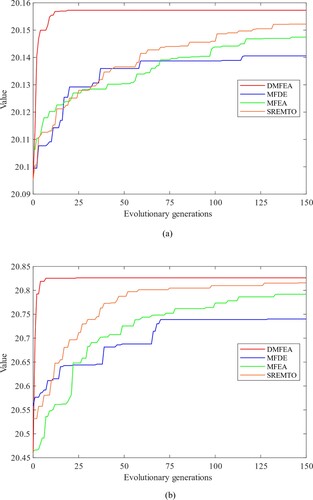
Table 3 The values of the seeds obtained by different algorithms when
is the optimisation task.
Table 4 The values of the seeds obtained by different algorithms when
is the optimisation task.
Figure 7. Convergence analysis of DMFEA with other optimisation methods using SF network (N = 500) as an example with seed size K = 20. (a) Convergence curves of different algorithms when used as the optimisation task (b) Convergence curves of different algorithms when taken as the optimisation task.
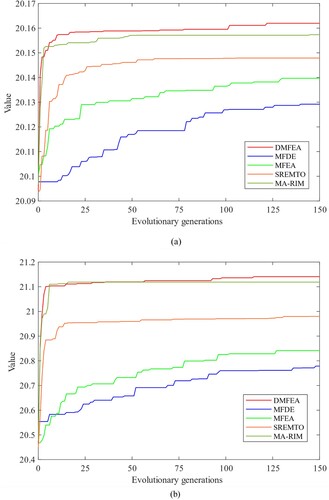
Table 5 The values of the seeds obtained by different algorithms.
Figure 8. Ablation experiment with K = 20. (a) Convergence curves of different algorithms when taken as the optimisation task (b) Convergence curves of different algorithms when taken as the optimisation task.
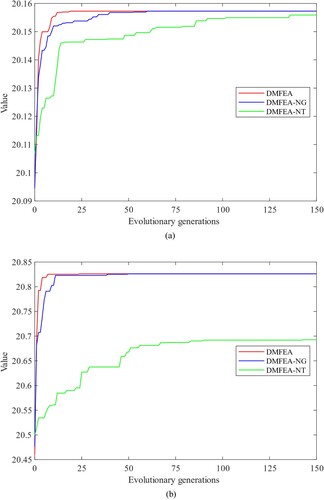
Figure 9. Algorithm convergence curves for different parameter settings on SF network (N = 500) with K = 20 for example. (a) pt (b) pg.
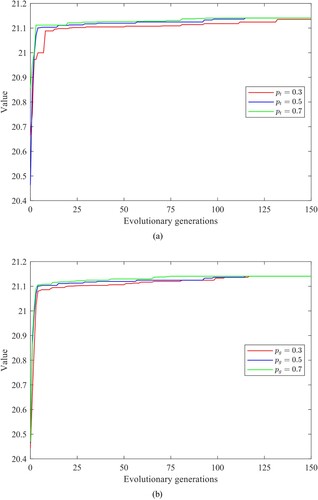
Table 6 Performance of different algorithms for different numbers of evaluations.
Table 7 Comparison of time used by different optimisation algorithms in hours.
Figure 10. Convergence analysis of DMFEA with other optimisation methods using Frid network as an example with seed size K = 20 (a) Convergence curves of different algorithms when is taken as the optimisation task (b) Convergence curves of different algorithms when
is taken as the optimisation task.
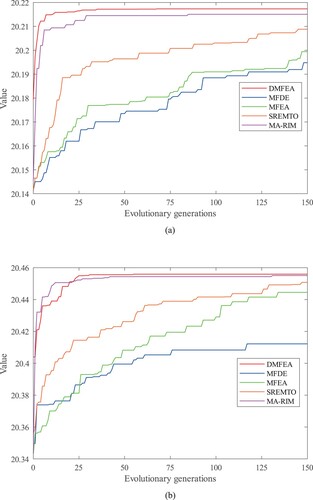
Figure 11. Convergence analysis of DMFEA with other optimisation methods using Robot network as an example with seed size K = 20 (a) Convergence curves of different algorithms when is taken as the optimisation task (b) Convergence curves of different algorithms when
is taken as the optimisation task.
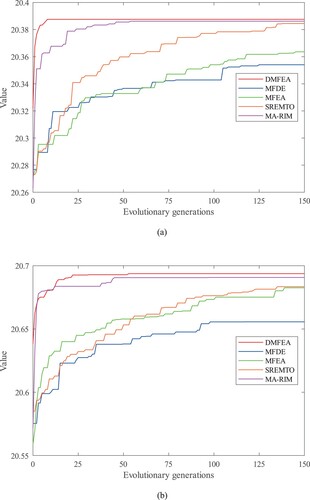
Figure 12. The distribution of seeds in the Frid network.
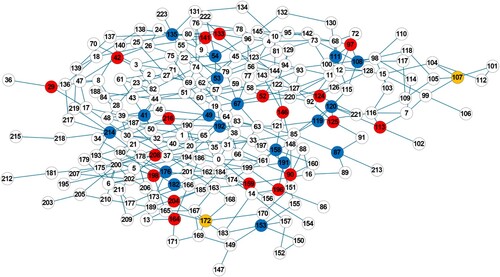
Figure 13. The distribution of seeds in the Robot network.
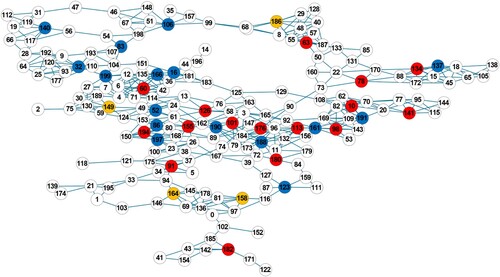
Table 8 The values of the seeds obtained by different algorithms when
is the optimisation task.
Table 9. The values of the seeds obtained by different algorithms when
is the optimisation task.
Data availability statement
The raw/processed data required to reproduce these findings cannot be shared at this time as the data also forms part of an ongoing study.