
Figures & data
Table 1. Network Security Situation Level Table.
Figure 1. RBF neural network structure.
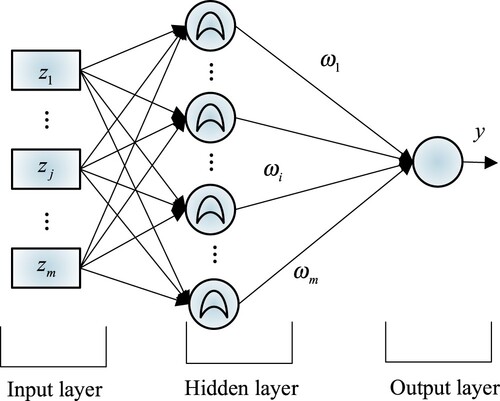
Table 2. Acquisition data format.
Figure 2. Algorithm flow chart.
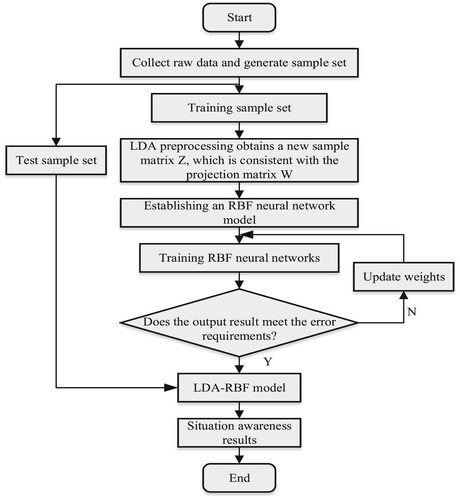
Figure 3. Power information network security situational awareness structure.
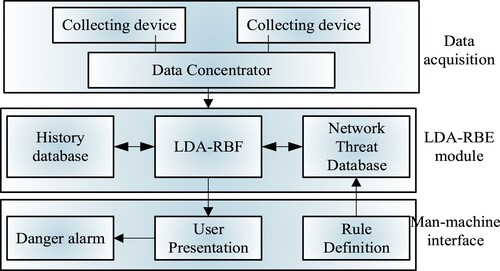
Table 3. Types of Attacks and Corresponding Sample Numbers.
Figure 4. Recognition rate by attack type.
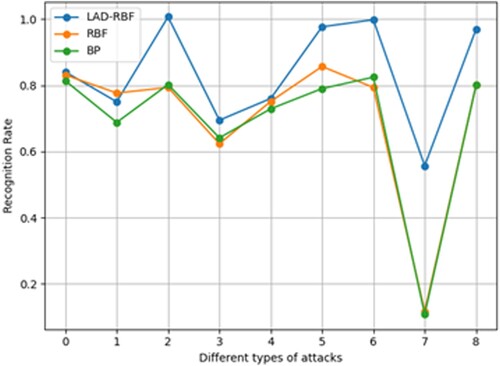
Table 4. Evaluation results for each method.
Table 5. Quantitative values of threat events.
Figure 5. Comparison of output results.
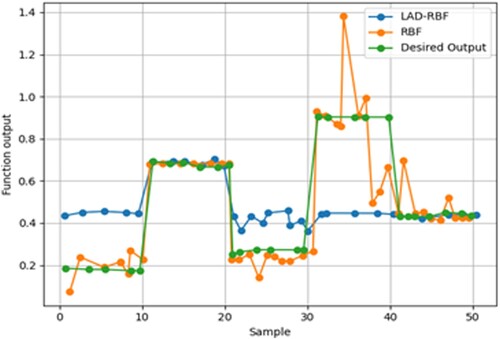
Figure 6. Error values for each test sample.
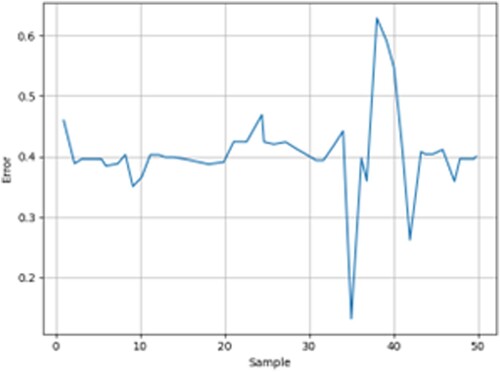
Table 6. Results of error evaluation indicators.
Figure 7. Power information network environment.
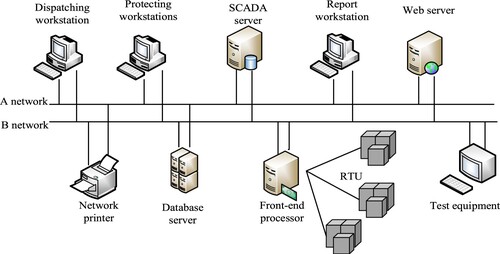
Table 7. Network Traffic Statistics under Normal Conditions.
Table 8. Packet statistics under normal.
Table 9. Time delay test results.
Table 10. Network traffic statistics under attack.
Table 11. Packet statistics under attack.
Table 12. Delay test results under attack.
Table 13. Sample Set.
Figure 8. Identification results for each attack in the information network.
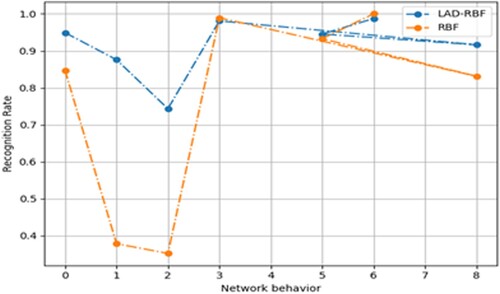
Table 14. Comparison of methods.
Data availability
The experimental data used to support the findings of this study are available from the corresponding author upon request.