
Figures & data
Table 1. Synthetized related work.
Figure 1. Methodology flowchart

Figure 2. The Structure of the fuzzy controller.
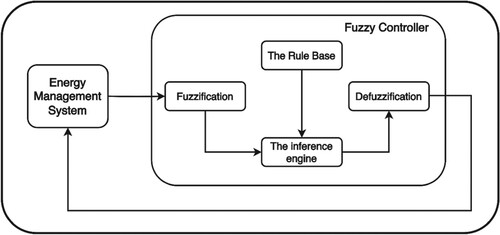
Figure 3. Numerical domain divided into fuzzy regions.
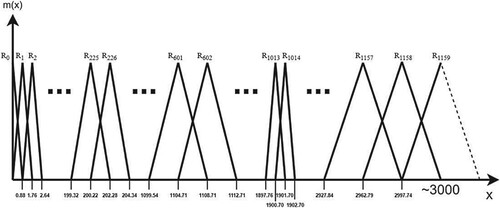
Figure 4. The structure of a fuzzy rule base.
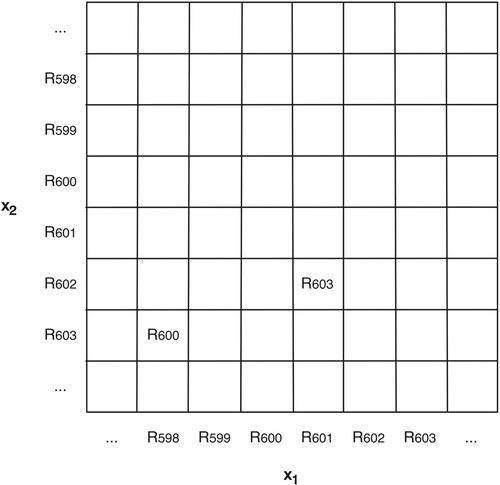
Figure 5. Input data mapping onto fuzzy rules.
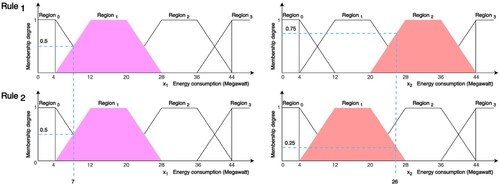
Figure 6. The result of the interference.
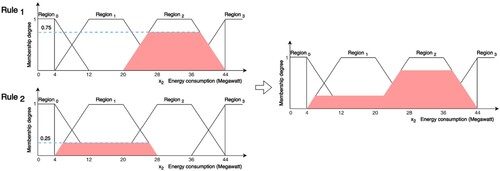
Table 2. Excerpt of electricity consumption from the AFEE dataset.
Figure 7. Data transformation.
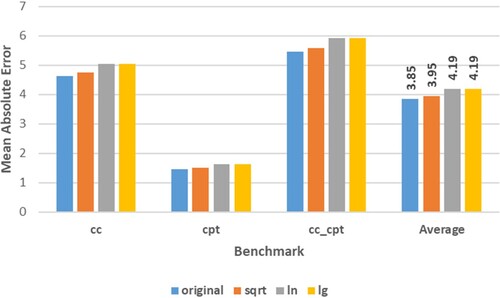
Figure 8. The influence of the data history length over the mean absolute error.
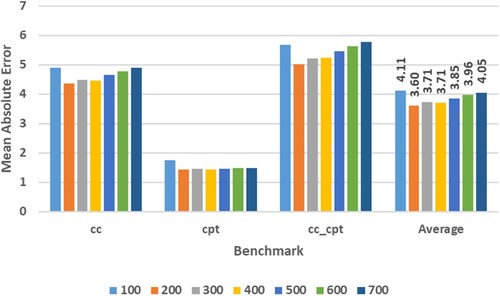
Figure 9. Varying the seasonality.
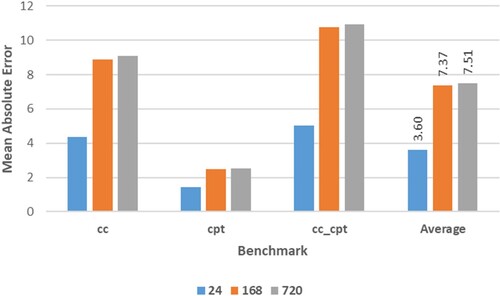
Figure 10. The influence of the number of inputs for the fuzzy rules.
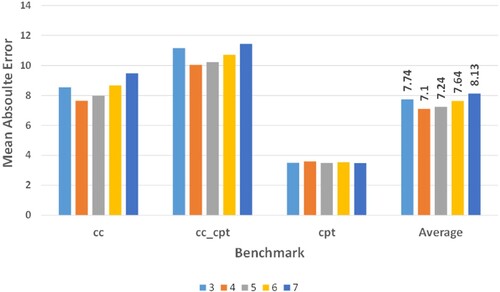
Figure 11. The influence of the number of training values.
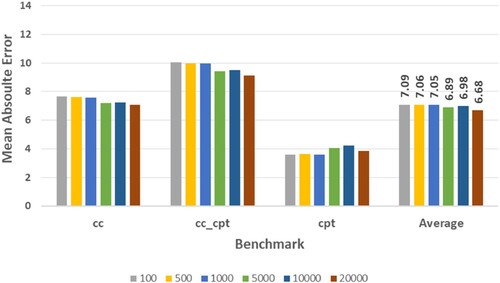
Figure 12. The influence of the method of solving the fuzzy rule base conflicts.
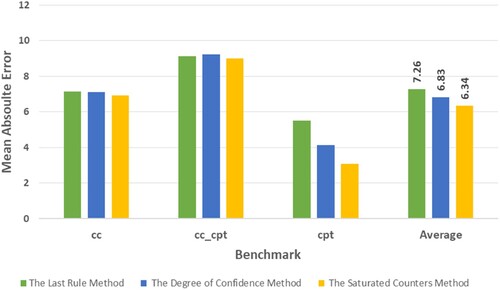
Figure 13. The influence of the number of counter states.
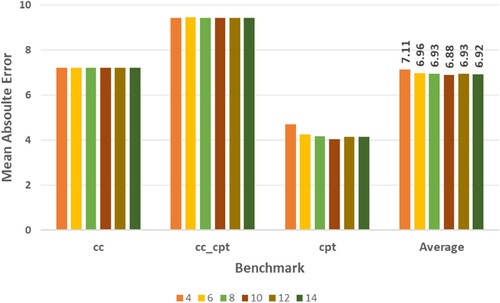
Figure 14. The influence of the threshold error value.
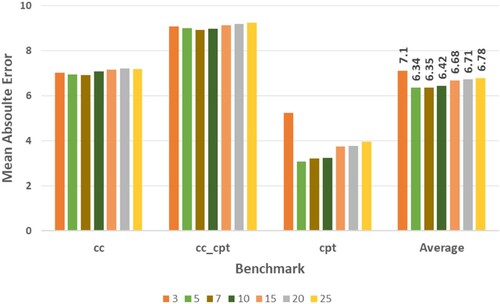
Figure 15. The influence of the defuzzification method.
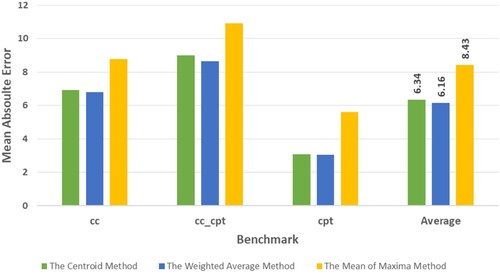
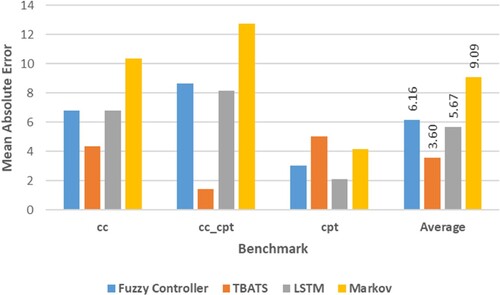
Figure 16. Comparison of the mean absolute error between different predictors.
Data availability statement
The code and excerpts from the dataset are available upon request.