Figures & data
Figure 1. Morphology of RAW264.7 cells cultured for 48 and 72 h after the addition of Dulbecco's modified Eagle's medium only (A and B), lipopolysaccharide at 1 µg/mL (C and D), whole cell (100 µg/mL) of Lactobacillus paracasei subsp. paracasei NTU 101 (E and F) and Lactobacillus plantarum NTU 102 (G and H), precipitate (100 µg/mL) of L. paracasei subsp. paracasei NTU 101 (I and J) and L. plantarum NTU 102 (K and L), and supernatant (100 µg/mL) of L. paracasei subsp. paracasei NTU 101 (M and N) and L. plantarum NTU 102 (O and P). Scale bar: 50 µm.
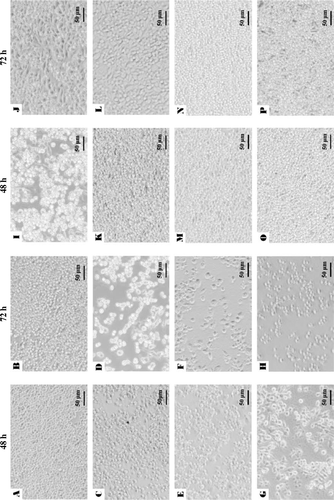
Table 1. Effect of whole cells and hydrolysates on cell viability in macrophage RAW 264.7 incubated for 24, 48 and 72 h.
Table 2. Effect of whole cells and hydrolysates on NO production (µM) in macrophage RAW 264.7 incubated for 24, 48 and 72 h.
Figure 2. Cytokines secretion from murine macrophages RAW 264.7 induced by hydrolysates of Lactobacillus paracasei subsp. paracasei NTU 101 (A) and Lactobacillus plantarum NTU 102 (B). Cytokines TNF-α, IL-1β, IL-6, IL-12 and IL-10 were analysed by ELISA. Macrophages (1×10⁵/well) were cultured with whole cell or bacterial hydrolysates from 0 to 100 µg/mL for 24 h and the supernatants were collected to analyse the cytokines. -⋄-: Supernatant, -□-: Precipitate, -Delta;-: Whole cell, -•- LPS. Each value is expressed as a mean±standard deviation (n=3). Means with asterisk were significantly different compared with supernatant group in each concentration (*p<0.01).
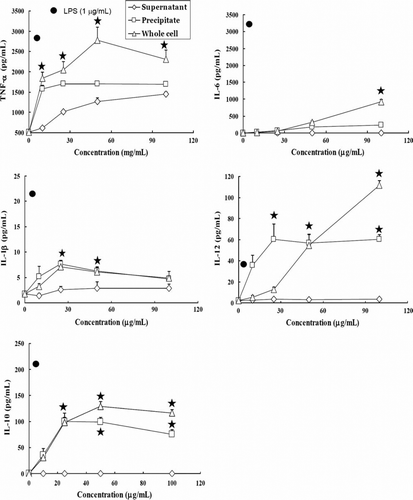
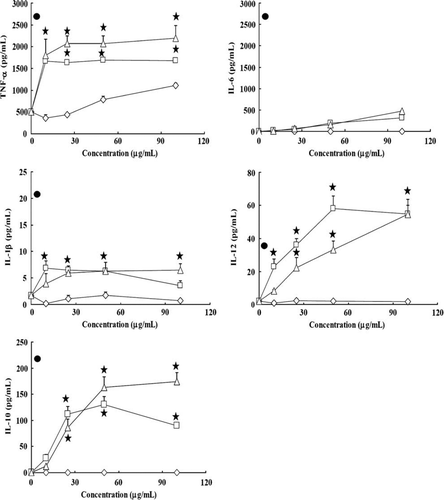
Table 3. The ratio of IL-12/IL-10 in supernatant from macrophages RAW 264.7 induced by Lactobacillus paracasei subsp. paracasei NTU 101 and L. plantarum NTU 102 precipitates of bacterial hydrolysates or whole cells incubated for 48 h.
Figure 3. Western blot analyses of COX-2 and β-actin expressions (A) and percentage of immunoblot density of COX-2 (B) in macrophages stimulated with Lactobacillus paracasei subsp. paracasei NTU 101 and L. plantarum NTU 102 hydrolysates. Macrophages (5×10⁵/well) were cultured with whole cell (W) or bacterial supernatant (S) and precipitate (P) hydrolysates for 24 h. Immunoblot density (%) = sample band intensity/LPS band intensity×100%. Each value is expressed as mean±standard deviation (n=3). Means with asterisk were significantly different compared with control group (*p<0.01).
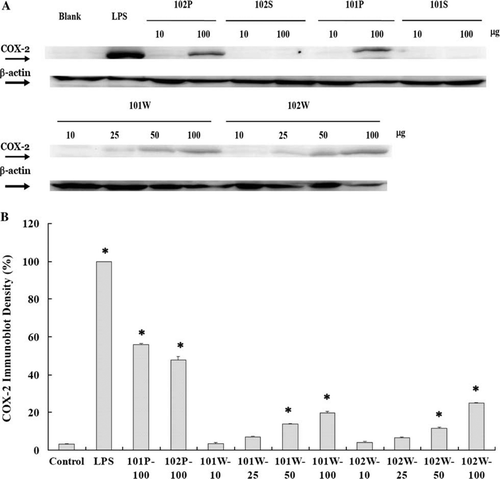
Figure 4. Histograms representing distributions of RAW 264.7 cells stimulated with Lactobacillus paracasei subsp. paracasei NTU 101 and L. plantarum NTU 102 hydrolysates (A). The graphic symbol of G0/G1 phase was blue solid; S phase was pink solid and G2/M phase was blue histogram. Quantification of the cell cycle distribution and the percentage of the distinct cell cycle phases in macrophages stimulated with lactobacilli hydrolysates were gated and calculated using the CXP software (B). (Macrophages (5×10⁵/well) were cultured with bacterial supernatant (S) and precipitate (P) hydrolysate for 24 h. Each value is expressed as mean±standard deviation (n=3). The symbol 101S-10, -25, -50 or -100 represented the concentration of 10, 25, 50 and 100 µg/mL, respectively. It is the same as in 101P, 102S and 102P. Means with asterisk at percentages of G2/M phase were significantly different in decrease or increase with respect to control groups in (B) (*p<0.01).
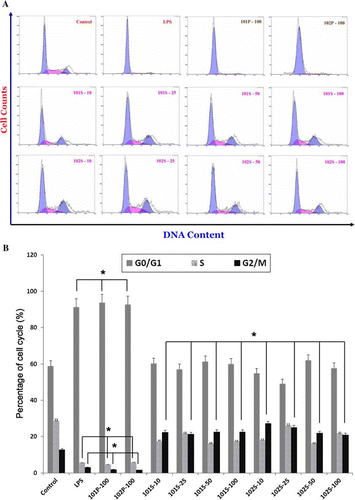
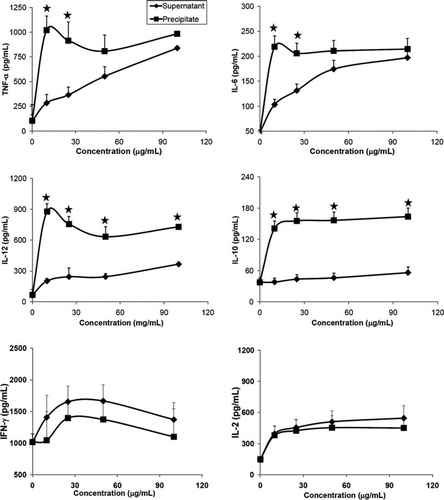
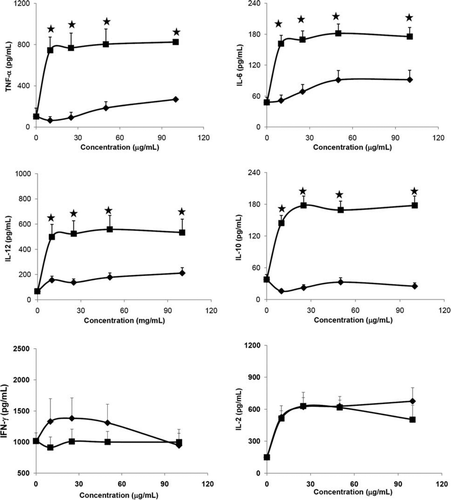
Figure 5. Cytokines secretion from splenocytes of C57BL/6J female mice induced by hydrolysates of Lactobacillus paracasei subsp. paracasei NTU 101 (A) and Lactobacillus plantarum NTU 102 (B). Cytokines TNF-α, IL-6, IL-10, IL-12, IL-2 and IFN-γ were analysed by ELISA. Splenocytes (1×10⁶ cells/100 µL per well) were cultured with precipitates or supernatants of bacterial hydrolysates from 10 to 100 µg/mL in RPMI-1640 for 24 h and the supernatants were collected. -♦-: Supernatant, -▪-: Precipitate. Each value is expressed as a mean±standard deviation (n=3). Means with asterisk were significantly different compared with supernatant group in each concentration (*p<0.01).