752
Views
0
CrossRef citations to date
0
Altmetric
Original Articles

Sunflower seed extract enhances the differentiation of osteoblastic MC3T3-E1 cells

Pages 9-19 | Received 24 Nov 2011, Accepted 25 Jul 2012, Published online: 28 Aug 2012

Figures & data

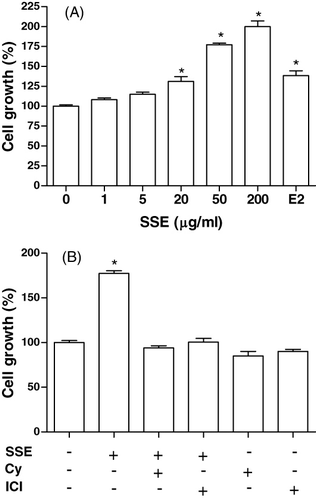
Figure 1. Effect of SSE on the growth of MC3T3-E1 cells. MC3T3-E1 cells were cultured with α-MEM containing 5% CD-FBS in the presence or absence of SSE for 48 h (A), and in combination with 50 µg/ml SSE and 10−6 M cycloheximide (Cy) or 10−6 M ICI182780 (ICI) (B). E2 (17β-oestradiol, 0.1 µM) was used as positive control. Data shown are mean±SEM, expressed as a percentage of control. The control value for MTT assay was 0.247±0.004 OD. *P<0.05 vs. control.
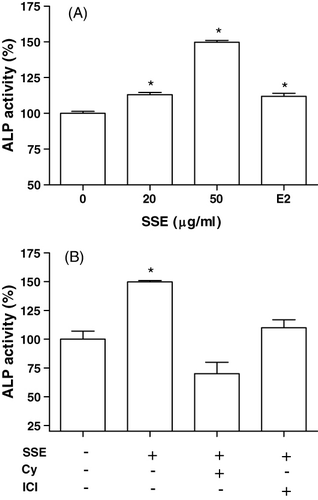
Figure 2. Effect of SSE on the alkaline phosphatase activity of MC3T3-E1 cells. After the cells reached confluence, the medium was replaced with phenol red-free α-MEM containing 5% CD-FBS in the presence or absence of SSE (A), and in combination with 50 µg/ml SSE and 10−6 M cycloheximide (Cy) or 10−6 M ICI182780 (ICI) (B). E2 (17β-oestradiol, 0.1 µM) was used as positive control. Data shown are mean±SEM, expressed as a percentage of control. The control value for ALP activity was 1.88±0.09 Unit/mg protein. *P<0.05 vs. control.
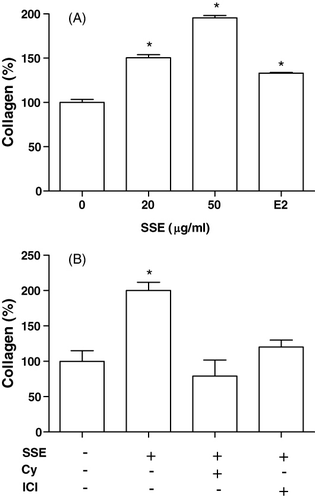
Figure 3. Effect of SSE on the collagen synthesis of MC3T3-E1 cells. After the cells reached confluence, the medium was replaced with phenol red-free α-MEM containing 5% CD-FBS in the presence or absence of SSE (A), and in combination with 50 µg/ml SSE and 10−6 M cycloheximide (Cy) or 10−6 M ICI182780 (ICI) (B). E2 (17β-oestradiol, 0.1 µM) was used as positive control. Data shown are mean±SEM, expressed as a percentage of control. The control value for collagen content was 2.83±0.43 µg per 107 cells. *P<0.05 vs. control.
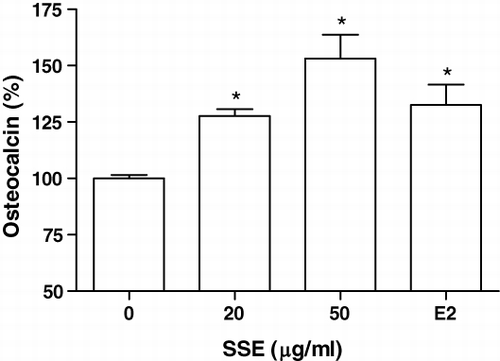
Figure 4. Effect of SSE on the osteocalcin secretion of MC3T3-E1 cells. After the cells reached confluence, the medium was replaced with phenol red-free α-MEM containing 5% CD-FBS in the presence or absence of SSE. Osteocalcin concentration was measured in the medium. E2 (17β-oestradiol, 0.1 µM) was used as positive control. Data shown are mean±SEM, expressed as a percentage of control. The control value for osteocalcin content was 0.11±0.002 ng per 106 cells. *P<0.05 vs. control.
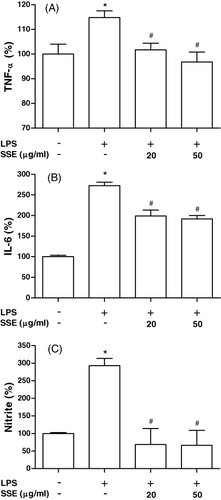
Figure 5. Effect of SSE on LPS-induced cytokines and NO production of MC3T3-E1 cells. MC3T3-E1 cells were cultured with vehicle or SSE in the presence of 5 µg/ml LPS for 48 h. TNF-α, IL-6 and nitrite concentrations were measured in the conditioned medium. Data shown are mean±SEM, expressed as a percentage of control. Control values of TNF-α, IL-6 and NO production were 7.45±0.17 pg/ml, 12.77±0.69 pg/ml and 47.06±3.27 mM, respectively, per 105 cells. *P<0.05 vs. control, #P<0.05 vs. LPS alone.

Reprints and Corporate Permissions

Please note: Selecting permissions does not provide access to the full text of the article, please see our help page How do I view content?

To request a reprint or corporate permissions for this article, please click on the relevant link below:

Academic Permissions

Please note: Selecting permissions does not provide access to the full text of the article, please see our help page How do I view content?

Obtain permissions instantly via Rightslink by clicking on the button below:

If you are unable to obtain permissions via Rightslink, please complete and submit this Permissions form. For more information, please visit our Permissions help page.