904
Views
4
CrossRef citations to date
0
Altmetric
Original Articles

Determination of histamine content in vegetable juices by using direct and competitive immunosensors

, , &
Pages 20-33 | Received 27 Feb 2012, Accepted 15 Sep 2012, Published online: 30 Oct 2012

Figures & data

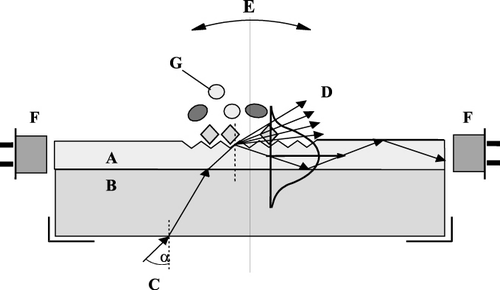
Figure 1. The schematic arrangement of an optical waveguide lightmode spectroscopy immunosensor. The sensor is constructed of an optical waveguide layer (A) on top of a glass support (B) and of a fine optical grating made in the waveguide. When polarised laser beam (C) (typically He–Ne laser with 632.8 nm wavelength) reaches the grating, it is diffracted. The angle of diffraction (D) depends not only on the optical parameters of the sensor, but also on the refractive index of the covering medium. The waveguide is gradually rotated around its rotation axis (E), and when the diffracted beam is incoupled into the waveguide, it is propagating towards the edge of the sensor through multiple internal reflections. The intensity of the incoupled light is measured with a photodiode (F). The light intensity vs. incoupling angle (α) follows a sharp, resonant peak profile. By measuring the incoupling angle vs. time, one can follow refractive index changes in real time. The change of the effective refractive index due to the presence/association/dissociation of the analyte molecules (G) at the sensor surface results in a shift in the incoupling resonance angle. Association/dissociation of molecules on the surface of the sensor chip can be followed with high precision without labelling and in real time by continuously measuring the change in the incoupling angle.
Figure 2. Calibration curve of the direct histamine detection method for standard solutions.
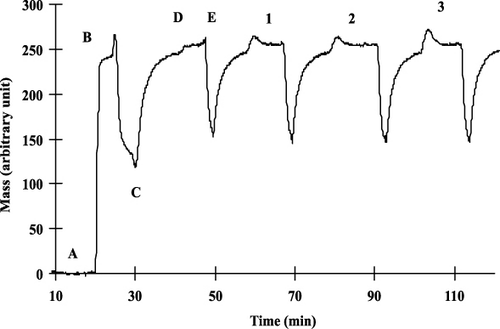
Figure 3. Immobilisation process of histamine-BSA conjugate and measuring cycles of different dilutions of anti-histamine antibody (A – distilled water, B – glutaraldehyde (2.5%), C – buffer, D – histamine-BSA conjugate (10 µg mL−1), E – HCl, 50 mM, 1 – 1:2000 dilution, 2 – 1:2000 dilution, 3 – 1:1000 dilution of antibody).
Figure 4. Choice of optimal monoclonal antibody dilution for competitive measurement of histamine.
Figure 5. Calibration curve of the competitive histamine detection method for standard solutions.
Figure 6. Antigen selectivity of OWLS immunosensor.

Table 1. The concentrations of the different biogenic amines determined by HPLC.

Figure 7. Histamine content in different samples measured by HPLC and OWLS immunosensor (A – Leavened cucumber; B – Sauerkraut 1; C – Sauerkraut 2; D – Pickles 1; E – Pickles 2; F – Fermented vegetable juice 1; G – Fermented vegetable juice 2; H – Fermented vegetable juice 3).

Reprints and Corporate Permissions

Please note: Selecting permissions does not provide access to the full text of the article, please see our help page How do I view content?

To request a reprint or corporate permissions for this article, please click on the relevant link below:

Academic Permissions

Please note: Selecting permissions does not provide access to the full text of the article, please see our help page How do I view content?

Obtain permissions instantly via Rightslink by clicking on the button below:

If you are unable to obtain permissions via Rightslink, please complete and submit this Permissions form. For more information, please visit our Permissions help page.