1,208
Views
43
CrossRef citations to date
0
Altmetric
Original Articles

A silver enhanced and sensitive strip sensor for Cadmium detection

, , , , &
Pages 287-300 | Received 16 Feb 2013, Accepted 25 Feb 2013, Published online: 10 Apr 2013

Figures & data

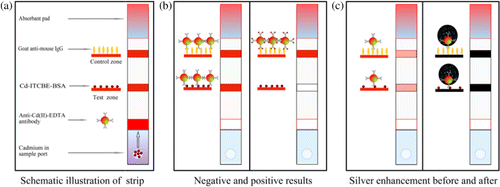
Figure 1. The scheme of antibody-based Cd(II) immunochromatographic strip (a), the negative and positive results (b) and silver enhancement before and after (c).
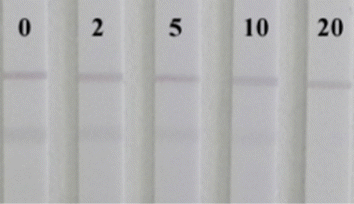
Figure 2. Immunochromatographic detection of Cd(II). A series of dilutions (2–20 µg/L) of Cd(II) was prepared in HBS.
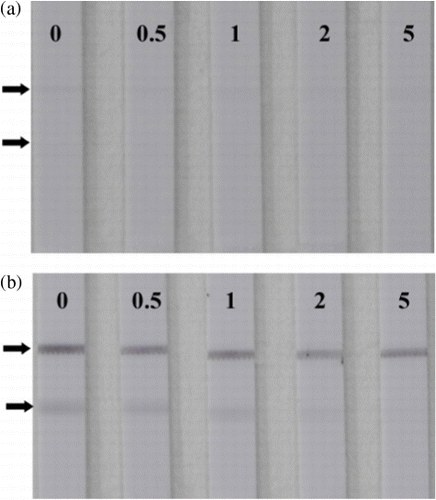
Figure 3. Immunochromatographic detection of Cd(II) with silver enhancement (b) and without (a). A series of dilutions (0.5–5µg/L) of Cd(II) was prepared in HBS.
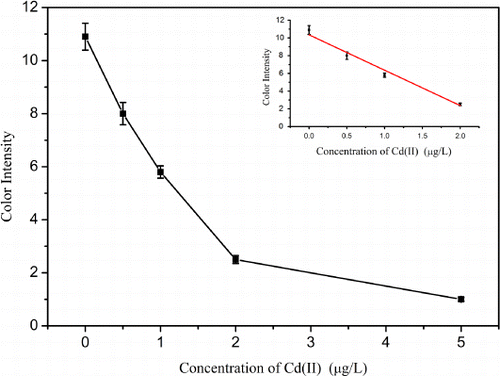
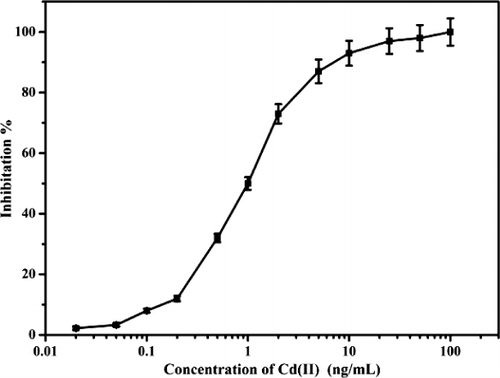
Figure 4. The calibration curve for detection of Cd (II) with silver enhancement. The optical responses of red bands on the strip were recorded with a strip reader. Each sample was analysed for three replicates.
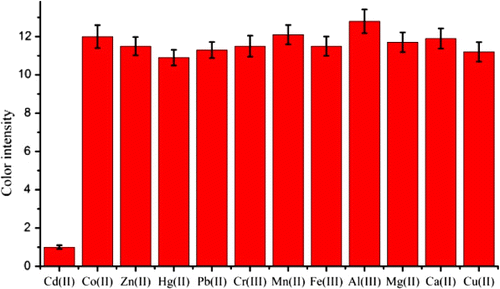
Figure 5. Cross-reactivity of other metal ions by the immunochromatographic strip. The optical responses of red bands on the strip were recorded with a strip reader. Each sample was analysed for three replicates.
Figure S1. TEM image of the synthesized gold nanoparticles.
Figure S2. Standard curve for detection of Cd(II) using ELISA. Each sample was analyzed for three replicates.

Table S1. The intra- and inter-assay of the visual sensor for Cd(II).

Table S2. Recovery test of Cd(II) in drinking water samples.

Reprints and Corporate Permissions

Please note: Selecting permissions does not provide access to the full text of the article, please see our help page How do I view content?

To request a reprint or corporate permissions for this article, please click on the relevant link below:

Academic Permissions

Please note: Selecting permissions does not provide access to the full text of the article, please see our help page How do I view content?

Obtain permissions instantly via Rightslink by clicking on the button below:

If you are unable to obtain permissions via Rightslink, please complete and submit this Permissions form. For more information, please visit our Permissions help page.