Figures & data
Table 1. The bacterial strains tested in this study.
Table 2. The sandwich ELISA for pair-wise interaction analysis (P/N value).
Table 3. The strains tested by optimized sandwich ELISA (n = 8).
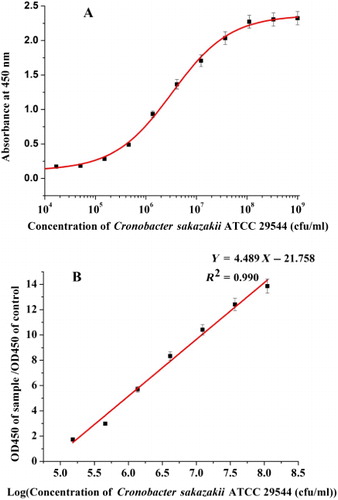
Note: The linear regression equation was y = 4.489x – 21.758. The linear correlation coefficient (R2) was 0.990.