859
Views
4
CrossRef citations to date
0
Altmetric
Original Articles

Assessment of Th1 and Th2 cytokine modulatory activity of an edible fern, Diplazium esculentum

&
Pages 690-702 | Received 01 Nov 2014, Accepted 11 Jan 2015, Published online: 10 Feb 2015

Figures & data

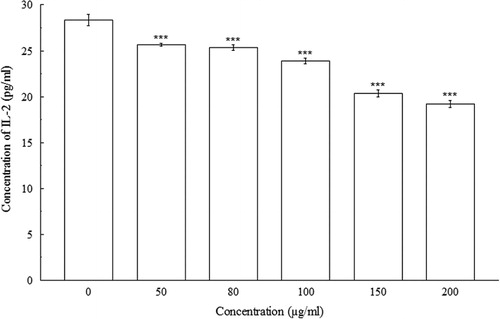
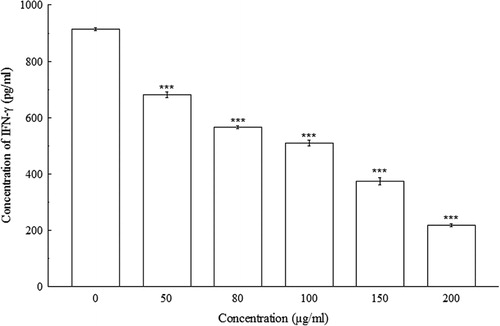
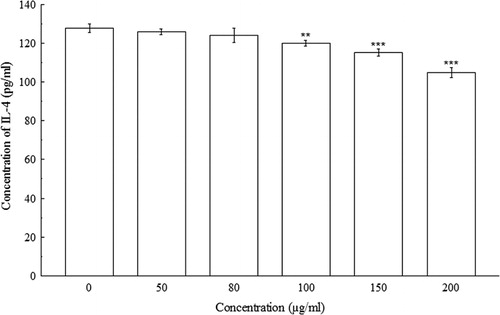
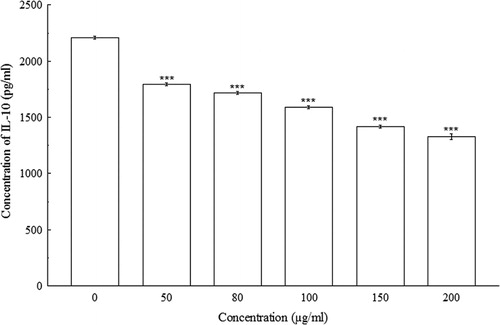
Table 1. Serum concentrations of different Th1 (IL-2 and IFN-γ) and Th2 (IL-4 and IL-10) cytokines of mice that are treated with different doses of BDE for 15 (S1) and 45 (S2) days.

Table 2. Serum concentrations of different Th1 (IL-2 and IFN-γ) and Th2 (IL-4 and IL-10) cytokines of mice that are treated with different doses of BDE for 90 (S3), 135 (S4) and 180 (S5) days.

Figure 1. Effect of different concentrations (0–200 µg/ml) of BDE on IL-2 production by con A induced splenocytes. Data represents significant concentration-dependent decrease in IL-2 production. The results are mean ± SD of three parallel observations. ***p < 0.001 vs. 0 µg/ml.
Figure 2. Effect of different concentrations (0–200 µg/ml) of BDE on IFN-γ production by con A induced splenocytes. Data represents significant concentration-dependent decrease in IFN-γ production. The results are mean ± SD of three parallel observations. ***p < 0.001 vs. 0 µg/ml.
Figure 3. Effect of different concentrations (0–200 µg/ml) of BDE on IL-4 production by con A induced splenocytes. Data represents significant concentration-dependent decrease in IL-4 production. The results are mean ± SD of three parallel observations. **p < 0.01 and ***p < 0.001 vs. 0 µg/ml.
Figure 4. Effect of different concentrations (0–200 µg/ml) of BDE on IL-10 production by con A induced splenocytes. Data represents significant concentration-dependent decrease in IL-10 production. The results are mean ± SD of three parallel observations. ***p < 0.001 vs. 0 µg/ml.

Reprints and Corporate Permissions

Please note: Selecting permissions does not provide access to the full text of the article, please see our help page How do I view content?

To request a reprint or corporate permissions for this article, please click on the relevant link below:

Academic Permissions

Please note: Selecting permissions does not provide access to the full text of the article, please see our help page How do I view content?

Obtain permissions instantly via Rightslink by clicking on the button below:

If you are unable to obtain permissions via Rightslink, please complete and submit this Permissions form. For more information, please visit our Permissions help page.