677
Views
6
CrossRef citations to date
0
Altmetric
Original Articles

Amelioration effect of bovine casein glycomacropeptide on ulcerative colitis in mice

, , , &
Pages 717-728 | Received 11 Jul 2014, Accepted 06 Feb 2015, Published online: 05 Mar 2015

Figures & data

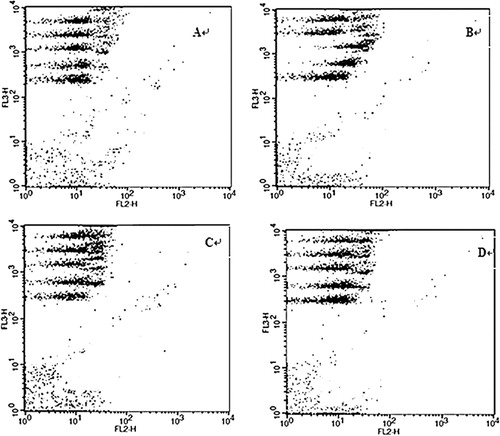
Figure 1. Serum levels of IL-2, IL-4, IL-5, IFN-γ, and TNF-α measured by CBA in different experimental groups. The mice (n = 10/group) treated with 3% oxazolone were supplemented with vehicle alone (B), SASP (C), or CGMP (D) in the basal diet. The mice (n = 10) fed with the basal diet alone served as a healthy control (A). The peripheral blood of each mouse was collected 4 h after the last supplementation and the serum levels of IL-2, IL-4, IL-5, IFN-γ, and TNF-α were measured by CBA. In each panel, the populations shown from the top to the bottom in terms of the fluorescence intensity in FL3-H channel represent IL-2, IL-4, IL-5, IFN-γ, and TNF-α, respectively. Data are representative from 10 independent experiments.
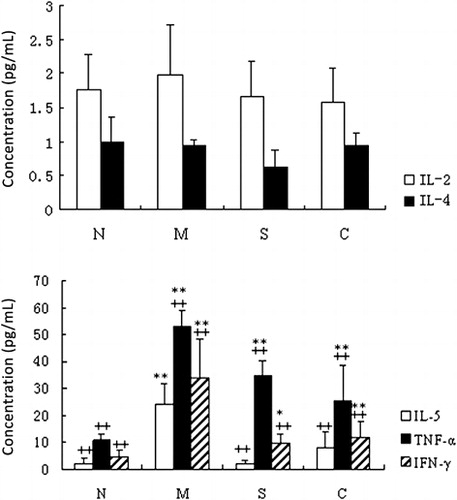
Figure 2. Quantification of the serum levels of IL-2, IL-4, IL-5, IFN-γ, and TNF-α measured by CBA in different experimental groups. The treatment and supplementation of the mice (n = 10/group) and the peripheral blood collection as described above (). The concentrations of each cytokine were calculated based on the cytokine standards measured in parallel. N, healthy control group; M, model of UC control group; S, SASP group; C, CGMP group. Data shown are the means ± SD from ten samples. *P < 0.05; **P < 0.01 between the healthy control and other groups. ++P < 0.01 between the UC control and other groups.
Figure 2. Quantification of the serum levels of IL-2, IL-4, IL-5, IFN-γ, and TNF-α measured by CBA in different experimental groups. The treatment and supplementation of the mice (n = 10/group) and the peripheral blood collection as described above (Figure 1). The concentrations of each cytokine were calculated based on the cytokine standards measured in parallel. N, healthy control group; M, model of UC control group; S, SASP group; C, CGMP group. Data shown are the means ± SD from ten samples. *P < 0.05; **P < 0.01 between the healthy control and other groups. ++P < 0.01 between the UC control and other groups.
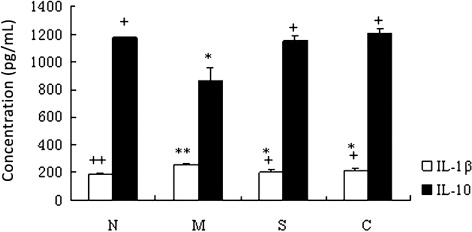
Figure 3. Serum levels of IL-1β and IL-10 determined by ELISA in different experimental groups. The treatment and supplementation of the mice (n = 10/group) and the peripheral blood collection as described above (). The mouse serum levels of IL-1β and IL-10 were determined by ELISA. N, healthy control group; M, model of UC control group; S, SASP group; C, CGMP group. Data shown are the means ± SD from 10 samples. *P < 0.05; **P < 0.01 between the healthy control and other groups. +P < 0.05; ++P < 0.01 between the UC control and other groups.
Figure 3. Serum levels of IL-1β and IL-10 determined by ELISA in different experimental groups. The treatment and supplementation of the mice (n = 10/group) and the peripheral blood collection as described above (Figure 1). The mouse serum levels of IL-1β and IL-10 were determined by ELISA. N, healthy control group; M, model of UC control group; S, SASP group; C, CGMP group. Data shown are the means ± SD from 10 samples. *P < 0.05; **P < 0.01 between the healthy control and other groups. +P < 0.05; ++P < 0.01 between the UC control and other groups.
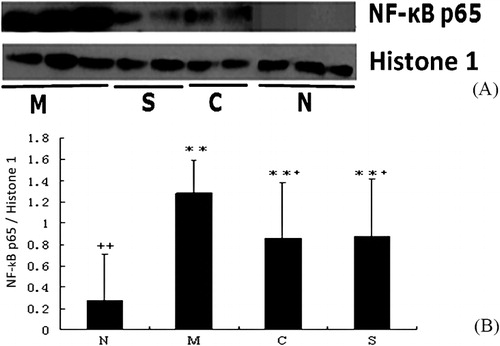
Figures 4. Expression of NF-κB p65 measured by Western blotting in different experimental groups. The treatment and supplementation of the mice (n = 10/group) as described above (). After blood collection, all the mice were sacrificed to collect colon. The tissue lysate was prepared for Western blotting analysis. Data shown are the representative image (A) and means ± SD (n = 10/group) of the relative expression of NF-κB p65 normalized to Histone 1 (B). N, healthy control group; M, model of UC control group; S, SASP group; C, CGMP group. **P < 0.01 between the healthy control and other groups. +P < 0.05; ++P < 0.01 between the UC control and other groups.
Figures 4. Expression of NF-κB p65 measured by Western blotting in different experimental groups. The treatment and supplementation of the mice (n = 10/group) as described above (Figure 1). After blood collection, all the mice were sacrificed to collect colon. The tissue lysate was prepared for Western blotting analysis. Data shown are the representative image (A) and means ± SD (n = 10/group) of the relative expression of NF-κB p65 normalized to Histone 1 (B). N, healthy control group; M, model of UC control group; S, SASP group; C, CGMP group. **P < 0.01 between the healthy control and other groups. +P < 0.05; ++P < 0.01 between the UC control and other groups.
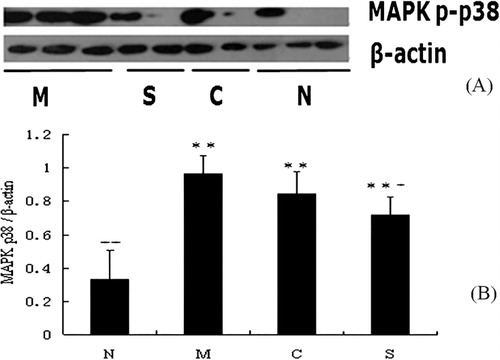
Figures 5. Expression of MAPK p-p38 measured by Western blotting in different experimental groups. The treatment and supplementation of the mice (n = 10/group), colon collection, and tissue lysate preparation as described above (). Data shown are the representative image (A) and means ± SD (n = 10/group) of the relative expression of MAPK p-p38 normalized to β-actin (B). N, healthy control group; M, model of UC control group; S, SASP group; C, CGMP group. **P < 0.01 between the healthy control and other groups. +P < 0.05; ++P < 0.01 between the UC control and other groups.
Figures 5. Expression of MAPK p-p38 measured by Western blotting in different experimental groups. The treatment and supplementation of the mice (n = 10/group), colon collection, and tissue lysate preparation as described above (Figure 4). Data shown are the representative image (A) and means ± SD (n = 10/group) of the relative expression of MAPK p-p38 normalized to β-actin (B). N, healthy control group; M, model of UC control group; S, SASP group; C, CGMP group. **P < 0.01 between the healthy control and other groups. +P < 0.05; ++P < 0.01 between the UC control and other groups.

Reprints and Corporate Permissions

Please note: Selecting permissions does not provide access to the full text of the article, please see our help page How do I view content?

To request a reprint or corporate permissions for this article, please click on the relevant link below:

Academic Permissions

Please note: Selecting permissions does not provide access to the full text of the article, please see our help page How do I view content?

Obtain permissions instantly via Rightslink by clicking on the button below:

If you are unable to obtain permissions via Rightslink, please complete and submit this Permissions form. For more information, please visit our Permissions help page.