904
Views
14
CrossRef citations to date
0
Altmetric
Original Articles

Development of a highly sensitive biotin–streptavidin enzyme-linked immunosorbent assay for detecting diethyl phthalate based on a specific polyclonal antibody

&
Pages 746-760 | Received 10 Sep 2014, Accepted 06 Mar 2015, Published online: 10 Apr 2015

Figures & data

Figure 1. The UV spectra of DEP hapten, protein and conjugates; absorbance value at characteristic peak, 336 nm: ODBSA-DEP = 0.630, ODDEP hapten = 0.138, ODBSA = 0.005; 360 nm: ODOVA-DEP = 0.424, ODDEP hapten = 0.020, ODOVA = 0.154; CBSA: 0.25g·L−1, COVA: 0.28g·L−1, Chapten: 0.05g·L−1; protein and conjugate were dissolved in PBS buffer; hapten was dissolved in DMF.

Table 1. Optimal concentrations of Bio-pAb-DEP and OVA-DEP.

Figure 2. Suitable operating conditions of the immunoassay method: (a) the blocking reagent, (b) ionic strength in PBS buffer, (c) pH of buffer, (d) concentrations of SA-HRP, (e) incubation time, and (f) the influence of different volume percentages of solvent on PBS buffer.
Figure 3. Standard curve for DEP analyzed by BA-ELISA. The concentrations of DEP were 0.001 μg·L−1, 0.005 μg·L−1, 0.01 μg·L−1, 0.05 μg·L−1, 0.1 μg·L−1, 0.5 μg·L−1, 1 μg·L−1, 2.5 μg·L−1, 5 μg·L−1, 10 μg·L−1, 25 μg·L−1, 50 μg·L−1. The linear range was from 0.021 μg·L−1 to 9.512 μg·L−1. The linear equation was Y = 22.53LogCDEP + 57.96 (R2 = 0.9832, n = 16).

Table 2. The variability of intra-assay and inter-assay test.

Table 3. CR of Bio-pAb-DEP with DEP structural analogs.

Figure 4. Comparison of data in wine samples by the BA-ELISA and GC–MS analysis. The regression equations was Y = 0.81X + 0.76 (R2 = 0.9748).

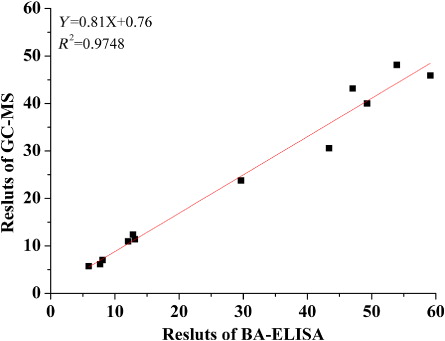
Table 4. Concentration of DEP in wine samples by BA-ELISA and GC–MS.

Table 5. Recovery of DEP detected by BA-ELISA and GC–MS in spiked wine samples.

Supplemental material

Supplementary_Material.pdf

Download PDF (194.7 KB)

Reprints and Corporate Permissions

Please note: Selecting permissions does not provide access to the full text of the article, please see our help page How do I view content?

To request a reprint or corporate permissions for this article, please click on the relevant link below:

Academic Permissions

Please note: Selecting permissions does not provide access to the full text of the article, please see our help page How do I view content?

Obtain permissions instantly via Rightslink by clicking on the button below:

If you are unable to obtain permissions via Rightslink, please complete and submit this Permissions form. For more information, please visit our Permissions help page.