Figures & data
Figure 1. Chemical structure of TIM, DES, and ATYL.
Table 1. Chemical structure of TYL.
Figure 2. Synthesis mechanism of TYL-CMO.
Figure 3. HPLC-MS analysis and identification of TYL-CMO: (a)–(d) the liquid chromatogram spectrum of TYL-CMO; (e) the mass spectrum of TYL-CMO.
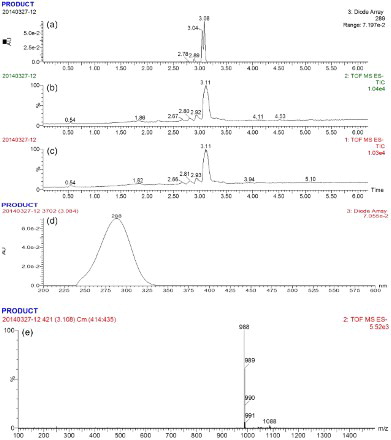
Figure 4. The UV–visible spectroscopy of TYL, protein and conjugated antigens: (a) confirmation of immunogen (TYL-CMO-BSA); (b) confirmation of coating antigen (TYL-CMO-OVA).
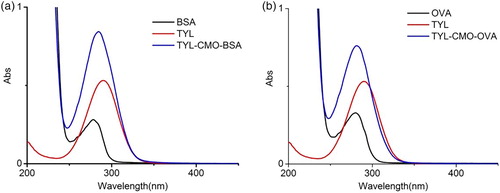
Figure 5. Optimization of standard dilution buffer for ic-ELISA: (a) NaCl content in PB; (b) pH value; (c) acetonitrile content; (d) standard curve of the TYL and TIM by optimized ic-ELISA.
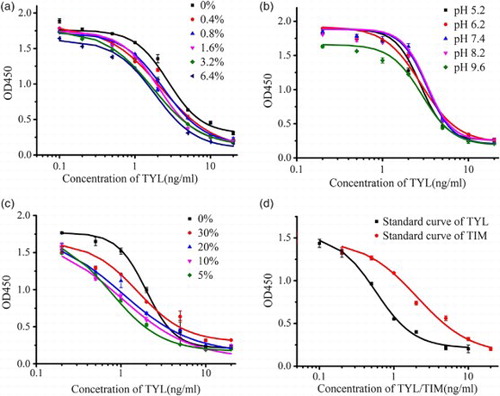
Table 2. CR of analogues and related compounds.
Table 3. Recovery determined by ic-ELISA in honey sample (n = 3).
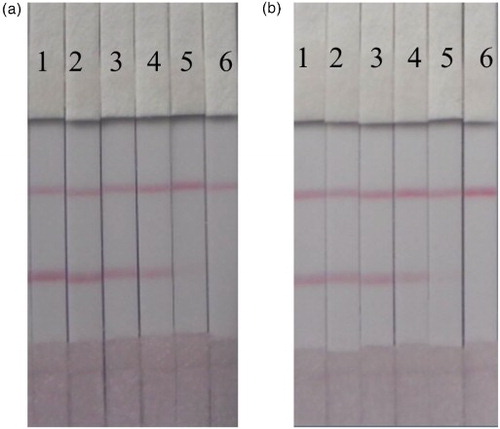
Figure 6. ICS result in PBS: (a) TYL (1 = 0 ng/ml, 2 = 0.5 ng/ml, 3 = 1 ng/ml, 4 = 2.5 ng/ml, 5 = 5 ng/ml, and 6 = 10 ng/ml); (b) TIM (1 = 0 ng/ml, 2 = 1 ng/ml, 3 = 2.5 ng/ml ppb, 4 = 5 ng/ml, 5 = 10 ng/ml, and 6 = 15 ng/ml).
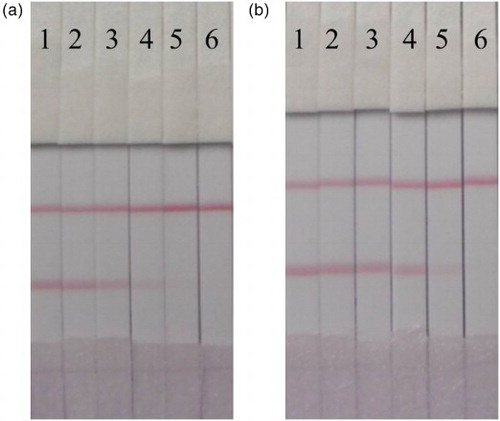
Figure 7. ICS assay result in honey sample: (a) TYL (1 = 0 ng/ml, 2 = 0.1 ng/ml, 3 = 0.25 ng/ml, 4 = 0.5 ng/ml, 5 = 1 ng/ml, and 6 = 2.5 ng/ml); (b) TIM (1 = 0 ng/ml, 2 = 0.25 ng/ml, 3 = 0.5 ng/ml, 4 = 1 ng/ml, 5 = 2.5 ng/ml, and 6 = 5 ng/ml).