Figures & data
Table 1. Fecal bile acid contents in mice (mg/g feces).
Table 2. The changes in SCFA contents in colon (mmol/g colonic contents).
Table 3. Incidence of colonic neoplasms.
Figure 1. Apoptosis detected by flow cytometry with Annexin V-FITC conjugated with PI staining. The first and second quadrants (upper right and upper left) of PI+ cells were necrotic cells and the third quadrant (lower left) for the PI–/AV– cells are normal cells. The numbers indicate apoptotic cells (AV–/PI+, lower right quadrant) in percent of total gated cells (mean ± SD, n = 3). a, b, c, d, e, and f represent the NC, MC, H-SOG, L-SOG, H-IOG, and L-IOG groups, respectively. A representative experiment taken from three similar repeats is shown.
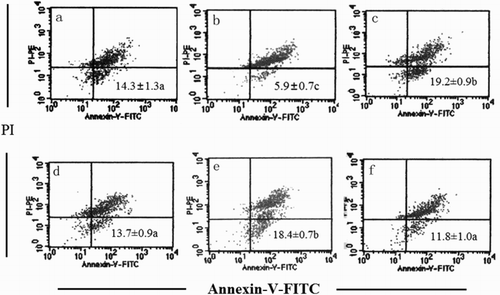
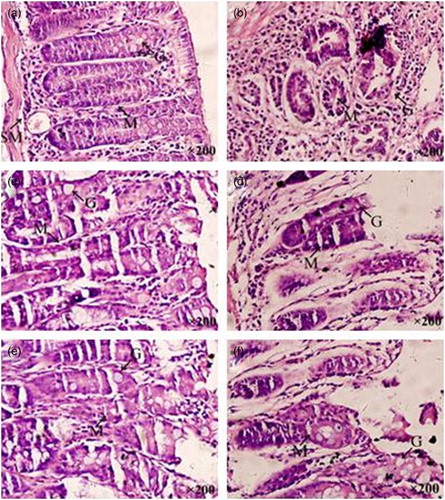
Figure 2. Photomicrograph of the colon of the NC (a), MC (b), H-SOG (c), L-SOG (d), H-IOG (e), and L-IOG (f) groups at week 18. Experimental groups exhibited minor dysplastic changes and injuries with varying degrees compared with the MC group. The H-SOG and H-IOG groups were almost the same as and similar to the NC group. Goblet cells (G), lymphocytic infiltration in mucosa (M), and edema in submucosa (SM) (H&E 200×).