Figures & data
Figure 1. (A) Principle of the Ic-ELISA analysis; (B) composition of the lateral-flow ICA strip; and (C) lateral-flow ICA strip detection with negative and positive sample.
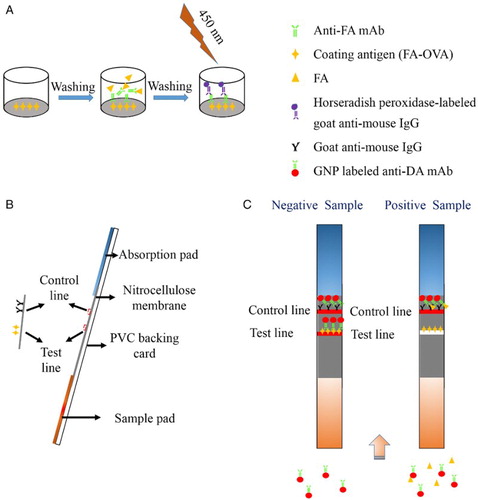
Figure 2. The UV–Vis spectra of different antigens. (A) Antigens with BSA as carrier protein; and (B) antigens with OVA as carrier protein.
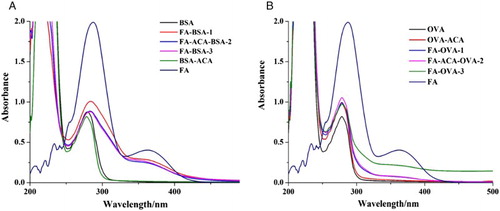
Figure 3. The SDS-PAGE analysis of different antigens. (A) Antigens with BSA as carrier protein: 1. BSA, 2. BSA-ACA, 3. FA-BSA-1, 4. FA-ACA-BSA-2, 5. FA-BSA-3; and (B) antigens with OVA as carrier protein: 1. OVA, 2. OVA-ACA, 3. FA-OVA-1, 4. FA-ACA-OVA-2, 5. FA-OVA-3.
Table 1. The evaluation of different immunogens and coating antigens.
Figure 4. The standard curve of developed Ic-ELISA method.
Table 2. The CR value against FA by the Ic-ELISA method.
Figure 5. The optimization of the lateral-flow ICA strip. (A) Strip with coating antigen at 0.5 mg/ml: 1. GNP-labeled mAb concentration of 8 µg/ml (pH 8.0); 2. GNP-labeled mAb concentration of 10 µg/ml (pH 8.0); 3. GNP-labeled mAb concentration of 8 µg/ml (pH 9.0); 4. GNP-labeled mAb concentration of 10 µg/ml (pH 9.0); (B) strip with coating antigen at 1 mg/ml: (1) GNP-labeled mAb concentration of 8 µg/ml (pH 8.0); (2) GNP-labeled mAb concentration of 10 µg/ml (pH 8.0); (3) GNP-labeled mAb concentration of 8 µg/ml (pH 9.0); and (4) GNP-labeled mAb concentration of 10 µg/ml (pH 9.0); (C) Optimization of two different combinations: (1) coating antigen at 0.5 mg/ml with a GNP-labeled mAb concentration of 10 µg/ml (pH 8.0); (2) coating antigen at 1 mg/ml with a GNP-labeled mAb concentration of 8 µg/ml (pH 8.0); and (D) optimization of resuspension solution for sample pad in 0.01 M PBS with 0.2% Tween-20: (1) 1% PEG 20000; (2) 1% OVA; (3) 1% BSA; and (4) 1% skim milk powder (w/w). N, FA-negative sample (0 ng/ml); P, FA-positive sample (2.5 ng/ ml).
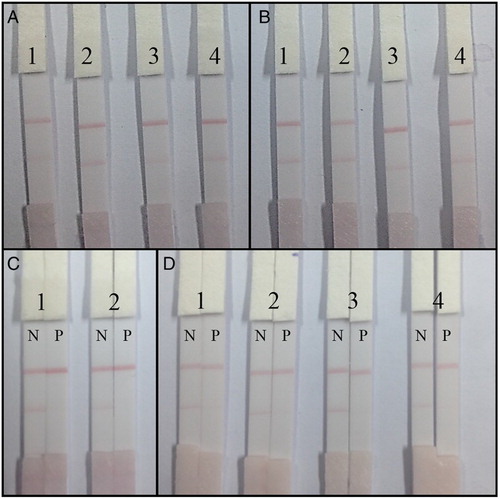
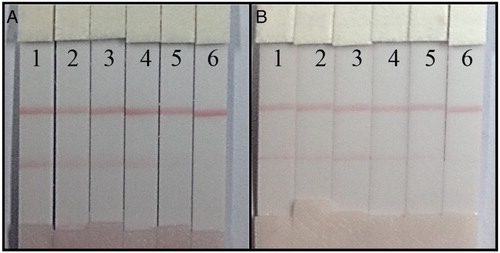
Figure 6. FA detection by lateral-flow ICA strip. (A) The ultrapure water samples: (1) 0 ng/ml; (2) 0.25 ng/ml; (3) 0.5 ng/ml; (4) 1 ng/ml; (5) 2.5 ng/ml; and (6) 5 ng/ml; (B) the milk samples (before detection, samples were diluted 50×): (1) 0 µg/100 ml; (2) 1.25 µg/100 ml; (3) 2.5 µg/100 ml; (4) 5 µg/100 ml; (5) 12.5 µg/100 ml; and (6) 25 µg/100 ml.