1,584
Views
19
CrossRef citations to date
0
Altmetric
Articles

Preparation and in vitro delivery performance of chitosan–alginate microcapsule for IgG

, , , &
Pages 1-13 | Received 19 Dec 2015, Accepted 25 May 2016, Published online: 08 Jul 2016

Figures & data

Figure 1. The effect of chitosan concentration on the microcapsule property. (a) LC and EE, (b) accumulative release. Other components include 1% (w/v) CaCl2, 2% (w/v) sodium alginate and 25% (w/w) BSA.
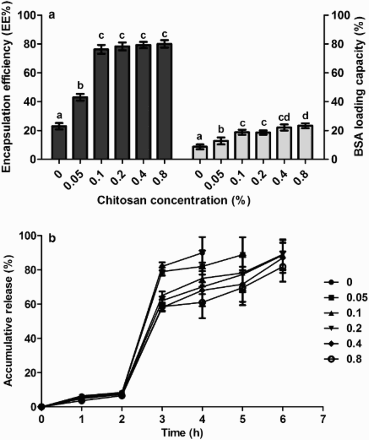
Figure 1. The effect of chitosan concentration on the microcapsule property. (a) LC and EE, (b) accumulative release. Other components include 1% (w/v) CaCl2, 2% (w/v) sodium alginate and 25% (w/w) BSA.

Figure 2. The effect of CaCl2 level on the microcapsules’ property. (a) LC and EE, (b) accumulative release. Other components include 0.1% (w/v) chitosan, 2% (w/v) sodium alginate and 25% (w/w) BSA.
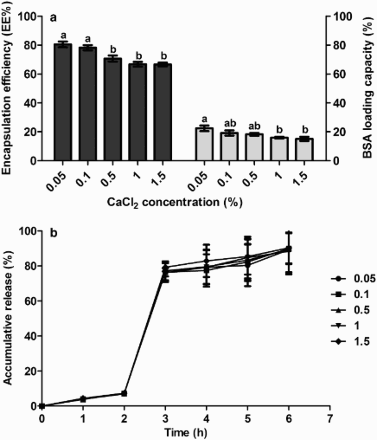
Figure 2. The effect of CaCl2 level on the microcapsules’ property. (a) LC and EE, (b) accumulative release. Other components include 0.1% (w/v) chitosan, 2% (w/v) sodium alginate and 25% (w/w) BSA.

Figure 3. The effect of sodium alginate concentration on the microcapsules’ property. (a) LC and EE, (b) accumulative release. Other components include 0.1% (w/v) chitosan, 0.5% (w/v) CaCl2 and 25% (w/w) BSA.
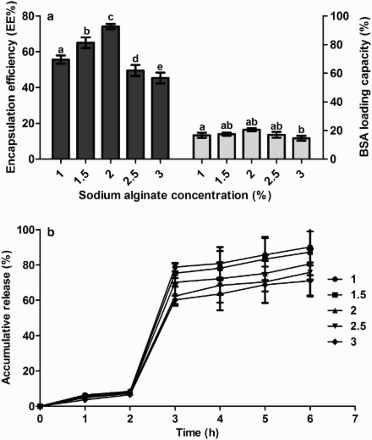
Figure 3. The effect of sodium alginate concentration on the microcapsules’ property. (a) LC and EE, (b) accumulative release. Other components include 0.1% (w/v) chitosan, 0.5% (w/v) CaCl2 and 25% (w/w) BSA.
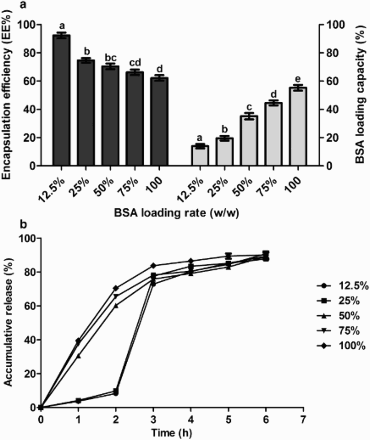
Figure 4. The effect of BSA loading rate (BSA/sodium alginate, w/w) on the microcapsules’ property. (a) LC and EE, (b) accumulative release. Other components include 0.1% (w/v) chitosan, 0.5% (w/v) CaCl2 and 2% (w/v) sodium alginate.

Figure 4. The effect of BSA loading rate (BSA/sodium alginate, w/w) on the microcapsules’ property. (a) LC and EE, (b) accumulative release. Other components include 0.1% (w/v) chitosan, 0.5% (w/v) CaCl2 and 2% (w/v) sodium alginate.

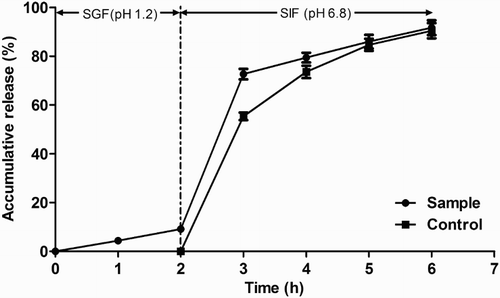
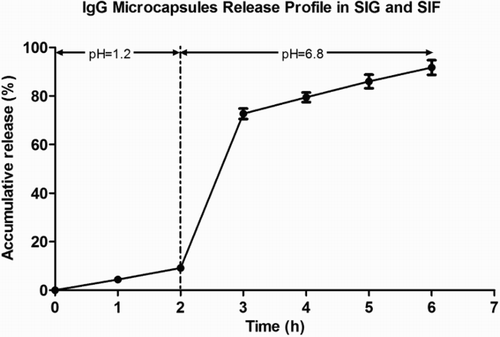
Figure 5. The release profile of IgG microcapsules in simulated gastrointestinal fluid in vitro. Microcapsules were directly exposed to SIF in control.

Figure 5. The release profile of IgG microcapsules in simulated gastrointestinal fluid in vitro. Microcapsules were directly exposed to SIF in control.

Reprints and Corporate Permissions

Please note: Selecting permissions does not provide access to the full text of the article, please see our help page How do I view content?

To request a reprint or corporate permissions for this article, please click on the relevant link below:

Academic Permissions

Please note: Selecting permissions does not provide access to the full text of the article, please see our help page How do I view content?

Obtain permissions instantly via Rightslink by clicking on the button below:

If you are unable to obtain permissions via Rightslink, please complete and submit this Permissions form. For more information, please visit our Permissions help page.