Figures & data
Figure 1. Principle of the lateral-flow immunochromatographic strip detection: (A) Composition of the lateral-flow immunochromatographic strip. (B) Strip detection with negative sample and positive sample.
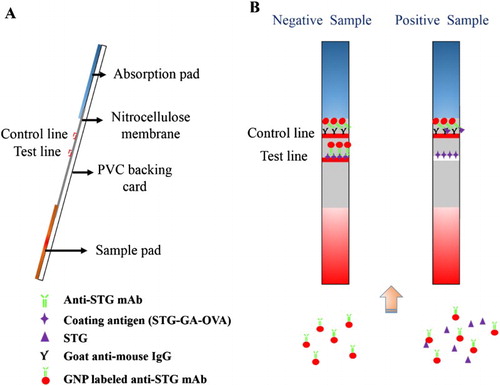
Figure 2. Structures of STG and STG-GA hapten.
Figure 3. LC-MS analysis of STG-GA hapten.
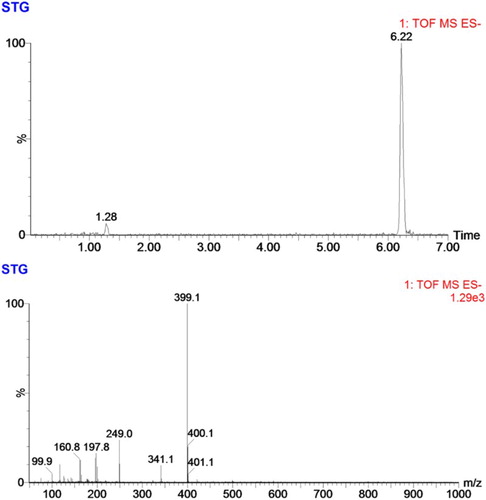
Figure 4. The UV–VIS spectra of different antigens (STG-BSA/STG-OVA).
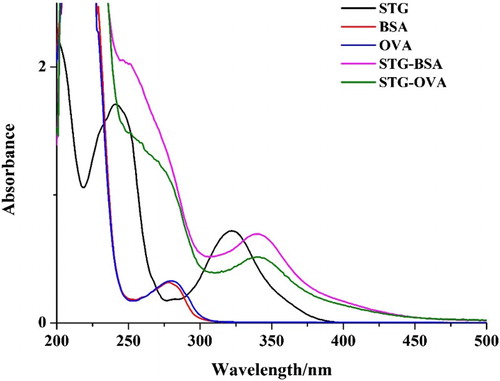
Figure 5. The optimization of ic-ELISA method. (A) The optimization with different pHs; (B) The optimization with different ionic strengths (NaCl content); (C) The optimization with different methanol contents; (D) The standard curve established under the optimum condition.
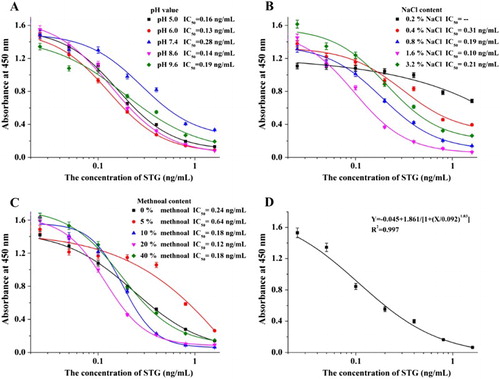
Table 1. The CR value of mAb against STG by the ic-ELISA method.
Figure 6. The optimization of the lateral-flow ICA strip. (A) Strip with coating antigen at 0.5 mg/mL: 1. GNP-labeled mAb under pH 8.0; 2. GNP-labeled mAb under pH 9.0; 3. GNP-labeled mAb under pH 10.0; (B) Strip with coating antigen at 1 mg/mL: 1. GNP-labeled mAb under pH 8.0; 2. GNP-labeled mAb under pH 9.0; 3. GNP-labeled mAb under pH 10.0. (the left: negative sample at 0 ng/mL; the right: positive sample at 1 ng/mL.).
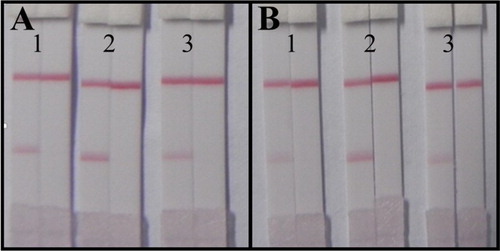
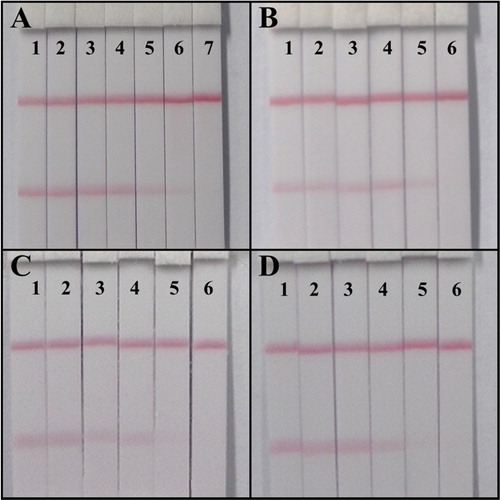
Figure 7. Lateral-flow ICA strip analysis. (A). Sensitive detection with STG standards: 1. 0; 2. 0.025; 3. 0.05; 4. 0.1; 5. 0.25; 6. 0.5; 7. 1; (B). The wheat sample analysis: 1. 0; 2. 0.6; 3. 1.2; 4. 3; 5. 6; 6. 12 ng/g; (C). The maize sample analysis: 1. 0; 2. 0.6; 3. 1.2; 4. 3; 5. 6; 6. 12 ng/g; (D). The rice sample analysis: 1. 0; 2. 0.6; 3. 1.2; 4. 3; 5. 6; 6. 12 ng/g.