Figures & data
Table 1. All primers’ sequences.
Figure 1. Effects of extractions on T cell subsets. CG, control group; E1, petroleum ether extractions; E2, ethyl acetate extractions; E3, ethanol extractions; PG, positive group. Experimental groups were expressed as a percentage of controls for cell viability. Values are expressed as the means ± SD from three independent experiments. *P < .05, **P < .01, versus CG.
Figure 2. Overlaid HPLC chromatograms of extractions E1–E3, and compound structure from extractions.
Figure 3. Effects of test compounds on T cell subsets. CG, control group; LG, low dose group; MG, medium dose group; HG, high dose group; PG, positive CG. Values are expressed as the means ± SD from three independent experiments. ∗P < .05, ∗∗P < .01 versus CG. A: physcion; B: echinulin; C: catenarin; D: emodin.
Figure 4. Effect of compounds on cytokine secretion in cell culture supernatant. The cytokine levels were quantified by ELISA. CG, control group; LG, low dose group; MG, medium dose group; HG, high dose group; PG, positive CG. Values are expressed as the means ± SD from three independent experiments. *P < .05, **P< .01 versus CG.
Figure 5. (A) Kinetics of the response of T lymphocytes to echinulin. (B) Effect of echinulin on cell proliferation. CG, control group; LG, low dose group; MG, medium dose group; HG, high dose group; PG, positive CG. PHA, phytohemagglutinin group.
Figure 6. Effects of echinulin on immunization-related protein expression. T cells were exposed to various concentrations of echinulin (100, 200, 400 μM) for 72 h. (A) and (B) Cellular proteins levels of p65, p-p65, IκBα and p-IκBα were examined by Western blot analysis. (C) Transcript levels of p65, IKBa were measured by RT-PCR. Values are expressed as the means ± SD from three independent experiments. *P < .05, **P < .01 versus CG.
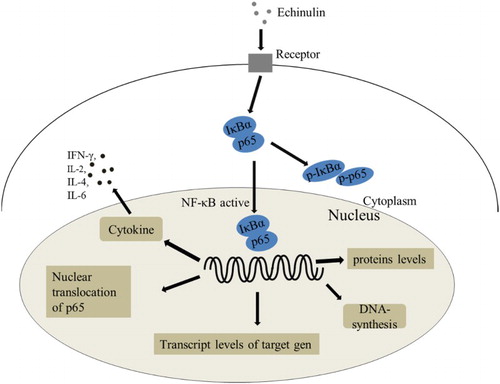
Figure 7. Echinulin enhances immunity in T cells by activating the NF-κB signaling pathways.