Figures & data
Figure 1. Chemical structure of ALD.
Figure 2. UV spectra characterization for ALD–OVA, ALD, and OVA.
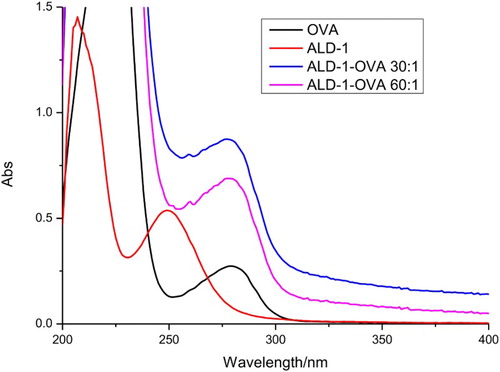
Figure 3. Illustration of typical strip test results. If the sample is negative (A), a positive result could be indicated only if the control line appears (B), and if the control and test line does not appear (invalid) (C).
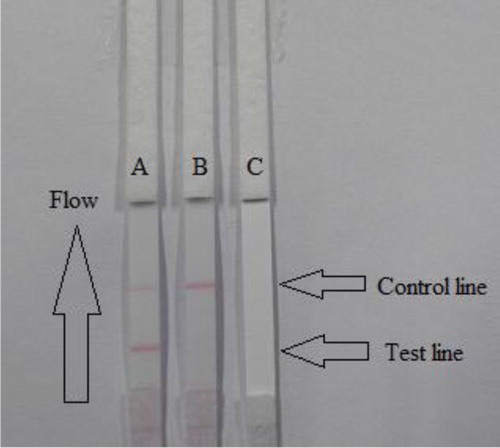
Figure 4. Result of using 14 kinds of reagent. 1 = suspension buffer, 2 = PVP, 3 = PEF, 4 = PVA, 5 = BSA, 6 = Casein, 7 = Sucrose, 8 = Trehalose, 9 = Sorbitol, 10 = Mannitol, 11 = tween-20, 12 = Brij-35, 13 = Triton X-100, and 14 = On-870.
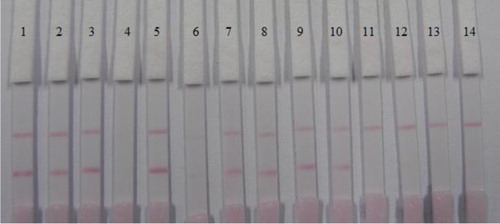
Figure 5. Result of optimization by using two kind of coating antigen ratio (1:30 and 1:60) and three kind of reagent solution (PVP, PEG, and BSA). A = 0 ng/mL and B = 5 ng/mL.
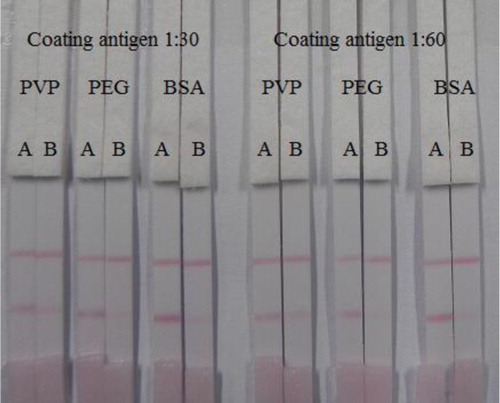
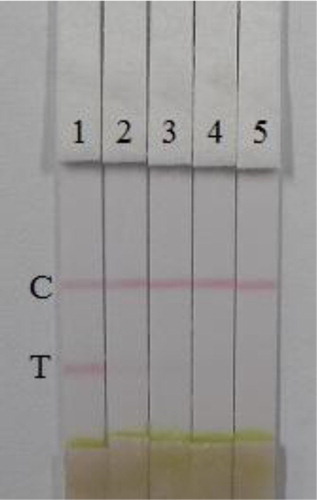
Figure 6. Colloidal gold immunochromatography assay for ALD in PBS (pH 7.4). ALD concentration: 1 = 0 ng/mL, 2 = 2.5 ng/mL, 3 = 5 ng/mL, 4 = 10 ng/mL, and 5 = 25 ng/mL. ALD, aldicarb; C, control line; T, test line.
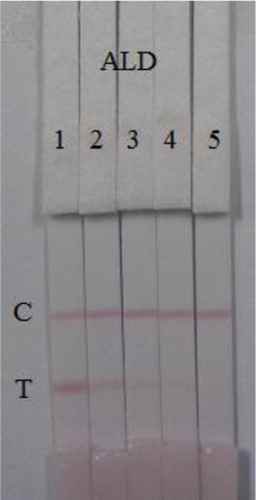
Figure 7. The results of calibration curves of ALD concentration with color density. All samples were analyzed for six replicates and error bars represent the standard deviations.
Figure 8. Results of ALD detection with colloidal gold immunochromatographic strip assay spiked in cucumber (n = 6). 1 = 0ppb, 2 = 10ppb, 3 = 20ppb, 4 = 50ppb, and 5 = 100ppb. C, control line; T, test line.