Figures & data
Figure 1. Chemical structures of MBF (a) and OFX (b).
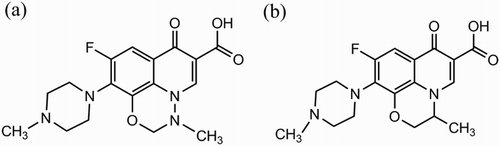
Figure 2. UV–vis spectra of MBF, BSA, and MBF–BSA.
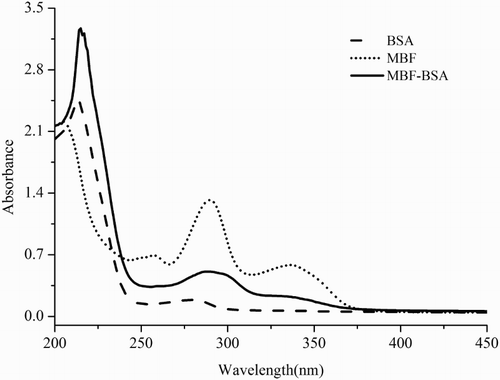
Table 1. Specificity of the MBF antibody.
Figure 3. Effects of coating buffer (a) pH value in the assay buffer, (b) ionic strength in the assay buffer on ELISA performance, (c) and inhibition curves for MBF and OFX by ELISA under optimal conditions (d).
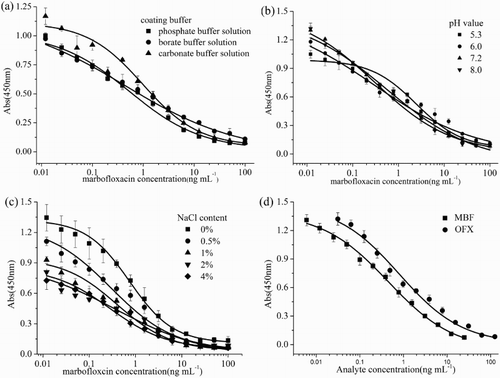
Table 2. Results of the spiked test.
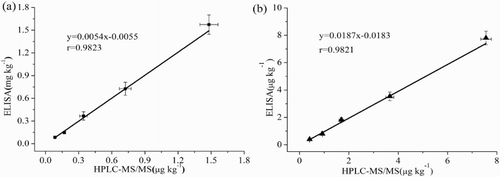
Figure 4. Comparative detection of MBF and OFX between the ELISA and HPLC–MS/MS.