1,368
Views
21
CrossRef citations to date
0
Altmetric
Articles

A competitive direct enzyme-linked immunosorbent assay for the rapid detection of deoxynivalenol: development and application in agricultural products and feedstuff

, , , , &
Pages 516-527 | Received 02 Jun 2016, Accepted 26 Feb 2017, Published online: 11 Apr 2017

Figures & data

Figure 1. Chemical structure of DON.

Figure 1. Chemical structure of DON.

Figure 2. Preparation of 3-HS-DON, (1) 17 mg of l-butaneboronic acid and 5 mg of DON were dissolved in 500 μL of dry pyridine. The mixture was stirred overnight at room temperature. (2) Then, 34 mg of succinic anhydride dissolved in 200 μL of dry pyridine was added to the mixture. After stirring for 3 h at 100°C, the mixture was dried under a nitrogen stream, re-suspended in ethyl acetate and washed three times with water. The organic phase was combined and dried under reduced pressure.

Figure 2. Preparation of 3-HS-DON, (1) 17 mg of l-butaneboronic acid and 5 mg of DON were dissolved in 500 μL of dry pyridine. The mixture was stirred overnight at room temperature. (2) Then, 34 mg of succinic anhydride dissolved in 200 μL of dry pyridine was added to the mixture. After stirring for 3 h at 100°C, the mixture was dried under a nitrogen stream, re-suspended in ethyl acetate and washed three times with water. The organic phase was combined and dried under reduced pressure.

Table 1. Cross-reactivity of DON antibody.

Figure 3. Standard curve of the cd-ELISA for DON: (a) in PBS, (b) in PBS

, barley
, wheat
, maize ( 
 ), flour (
), oat
, rice (I), milk
and feedstuff
samples.

Figure 3. Standard curve of the cd-ELISA for DON: (a) in PBS, (b) in PBS Display full size, barley Display full size, wheat Display full size, maize ( Display full size ), flour (Display full size ), oat Display full size, rice (I), milk Display full size and feedstuff Display full size samples.

Figure 4. Effect of the methanol on the maximum absorbance (▪) and sensitivity of the assay (◆).

Figure 4. Effect of the methanol on the maximum absorbance (▪) and sensitivity of the assay (◆).

Figure 5. Effect of the ionic strength on the maximum absorbance (▪) and sensitivity of the assay (◆).

Figure 5. Effect of the ionic strength on the maximum absorbance (▪) and sensitivity of the assay (◆).
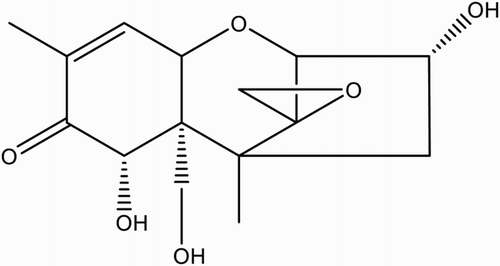
Table 2. Recovery studies of eight samples at three levels by ELISA (n = 3).

Figure 6. Comparison of ELISA and HPLC for the determination of DON.

Figure 6. Comparison of ELISA and HPLC for the determination of DON.

Reprints and Corporate Permissions

Please note: Selecting permissions does not provide access to the full text of the article, please see our help page How do I view content?

To request a reprint or corporate permissions for this article, please click on the relevant link below:

Academic Permissions

Please note: Selecting permissions does not provide access to the full text of the article, please see our help page How do I view content?

Obtain permissions instantly via Rightslink by clicking on the button below:

If you are unable to obtain permissions via Rightslink, please complete and submit this Permissions form. For more information, please visit our Permissions help page.