Figures & data
Table 1. Prime sequences of IL-2, IL-10, IFN-γ, CD4 and CD8 used in RTFQ-PCR.
Figure 1. Electrophoresis spectra of DNA marker and RTFQ-PCR products of endogenous reference gene (β-actin) and target genes (IL-2, CD4, CD8, IL-10 and IFN-γ). Channel M: DNA marker; Channel 1: IL-2 (about 120 bp); Channel 2: CD4 (about 115 bp); Channel 3: CD8 (about 130 bp); Channel 4: β-actin (about 275 bp and 175 bp); Channel 5: IL-10 (about 200 bp); Channel 6: IFN-γ (about 180 bp).
Table 2. Effects of crude HCPS on the content of IL-2, IL-10, IFN-γ, iNOS, CD4, CD8 and cAMP in spleen in vivo by ELISA.
Table 3. Effects of crude HCPS on the mRNA synthesis of IL-2, IL-10, IFN-γ, CD4 and CD8 in spleen in vivo by RTFQ-PCR.
Table 4. Effects of crude HCPS on the content of IL-10 and cGMP in serum in vivo by ELISA.
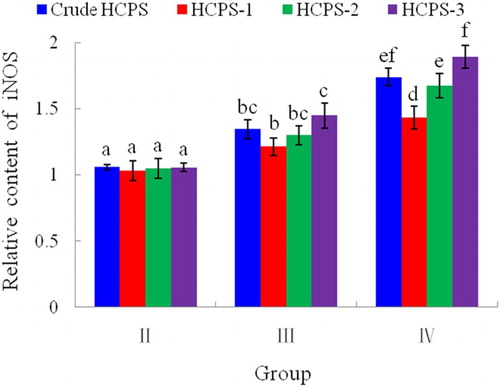
Figure 2. Effects of HCPS on the gene expression of iNOS in peritoneal macrophage in vitro by ELISA. Group I: control group; Group II: low dose of HCPS (50 μg/mL); Group III: medium dose of HCPS (100 μg/mL); Group IV: high dose of HCPS (200 μg/mL). Different letter (a, b, c, d, e, f) indicted there was significant difference (P < .05) between groups. Same letter suggested difference between groups was not significant (P > .05).