Figures & data
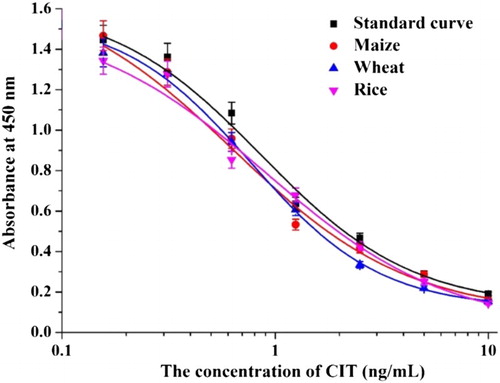
Figure 1. Principle of the lateral-flow immunochromatographic strip detection. (A) Composition of the lateral-flow immunochromatographic strip. (B) Strip detection with negative sample and positive sample.
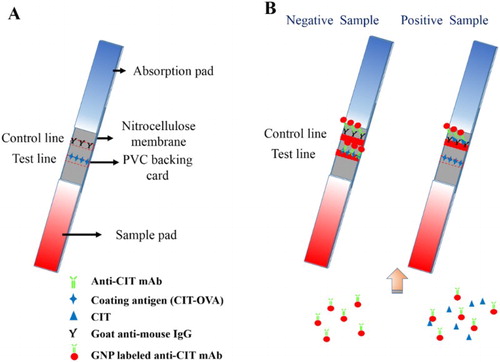
Figure 2. The UV-Vis spectra of different antigens (CIT-BSA/CIT-OVA).
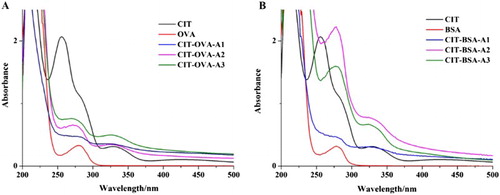
Table 1. The evaluation of different immunogens and coating antigens.
Figure 3. The optimization of ic-ELISA. (A) The optimization of ic-ELISA method with different methanol content; (B) The optimization of ic-ELISA method with different ionic strength (NaCl content); (C) The optimization of ic-ELISA method with different pH values; and (D) The standard curve established under the optimum condition.
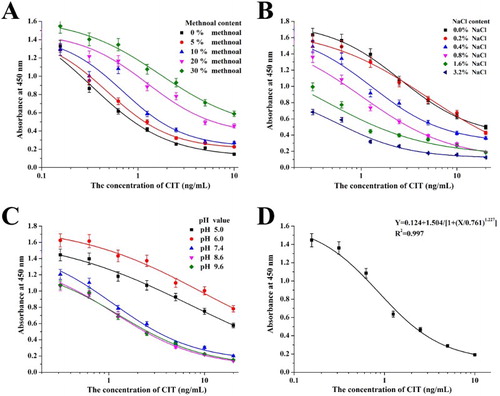
Table 2. The CR value of mAb against CIT by the ic-ELISA.
Figure 4. The analysis of lateral-flow ICA strip by naked eyes. (A) The sensitive analysis with CIT: (1) 5 ng/ml; (2) 2.5 ng/ml; (3) 1 ng/ml; (4) 0.5 ng/ml; (5) 0.25 ng/ml; (6) 0 ng/ml; (B) The CIT-spiked maize sample: (1) 80 ng/g; (2) 40 ng/g; (3) 20 ng/g; (4) 8 ng/g; (5) 4 ng/g; (6) 0 ng/g; (C) The CIT-spiked wheat sample: (1) 80 ng/g; (2) 40 ng/g; (3) 20 ng/g; (4) 8 ng/g; (5) 4 ng/g; (6) 0 ng/g; and (D) The CIT-spiked rice sample: (1) 80 ng/g; (2) 40 ng/g; (3) 20 ng/g; (4) 8 ng/g; (5) 4 ng/g; (6) 0 ng/g.
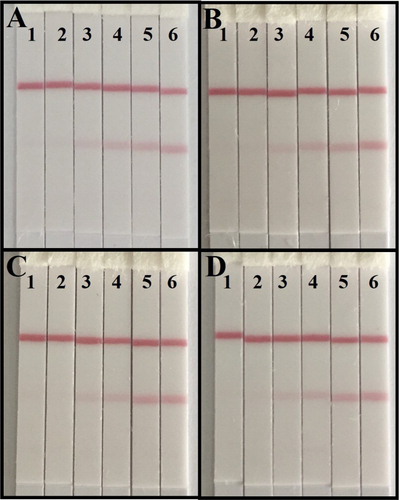
Figure 5. The analysis of lateral-flow ICA strip by strip scan reader. (A) The standard curve of ICA strip by strip scan reader; (B) The calibration curve of ICA strip by strip scan reader with different sample.
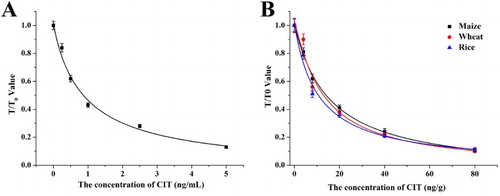
Figure 6. The calibration curve of ic-ELISA with different sample.