Figures & data
Figure 1. Chemical structure of acetamiprid.
Figure 2. The UV spectra characterization for AC-BSA, AC, and BSA.
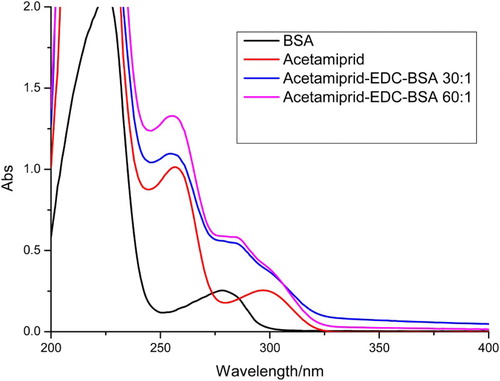
Figure 3. Illustration of typical strip test results. If the sample is negative (A), a positive result could be indicated only if the control line appears (B), and if the control and test line does not appears (invalid) (C).
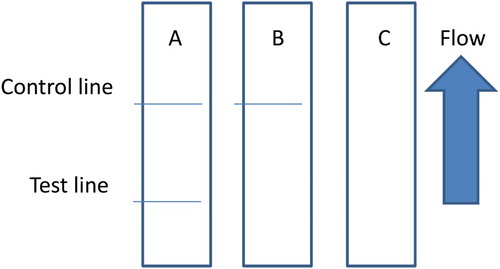
Figure 4. The UV absorption spectra of hapten-OVA conjugate.
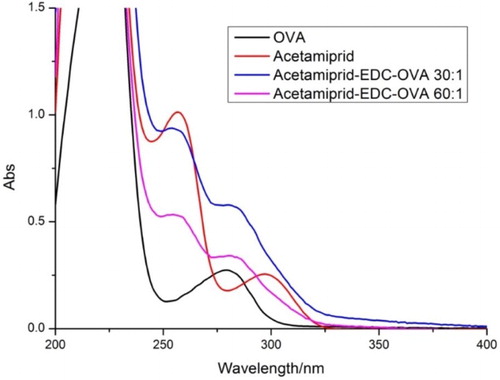
Figure 5. Optimization of the immunochromatographic strip by using different coating antigen. (1) AC: OVA (1:60); (2) AC:BSA (1:60); (3) AC:BSA (1:30); and (4) AC: OVA (1:30). 0 = 0 ng/mL and 20 = 20 ng/mL.
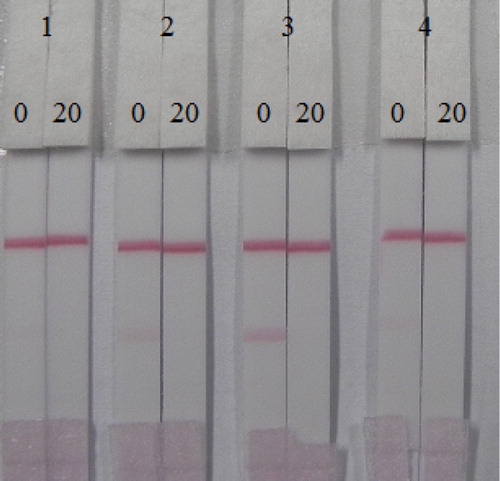
Figure 6. Colloidal gold immunochromatography assay for AC. AC concentration (from left to right): 1 = 0 ng/mL, 2 = 0.1 ng/mL, 3 = 0.25 ng/mL, 4 = 0.5 ng/mL, and 5 = 1 ng/mL. C, control line. T, test line.
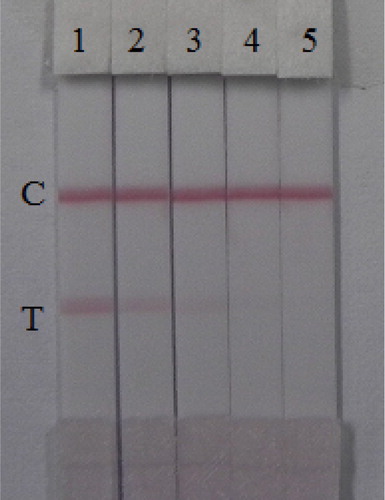
Figure 7. The result calibration curves of effect AC concentration (0, 0.1, 0.25, 0.5, and 1 ng/mL) with the color intensity. Each sample was analyzed for six replicates and error bars represent the standard deviations.
Figure 8. The cross-reaction of the AC test strip with TC (concentrations: 1 = 0 ng/mL, 2 = 0.005 ng/mL, 3 = 0.01 ng/mL, 4= 0.025 ng/mL, 5 = 0.05 ng/mL, 6 = 0.1 ng/mL, and 7 = 0.25 ng/mL). T, test line. C, control line.
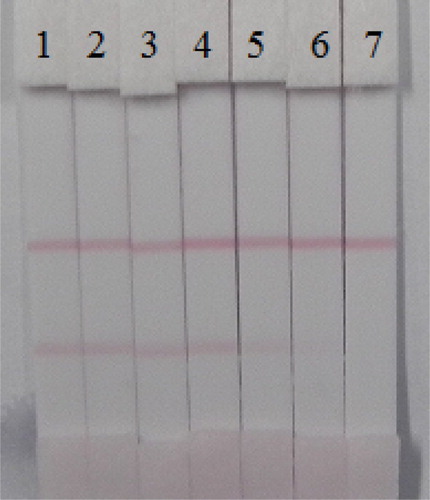
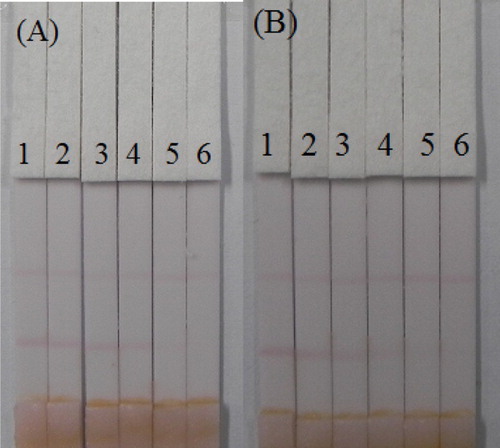
Figure 9. Results of AC and TC detection with colloidal gold immunochromatographic strip assay spiked in cucumber. (A) Acetamiprid. (B) Thiacloprid. 1 = 0 ng/mL, 2 = 0.1 ng/mL, 3 = 0.25 ng/mL, 4 = 0.5 ng/mL, 5 = 1 ng/mL 6 = 2.5 ng/mL, and 7 = 5 ng/mL.
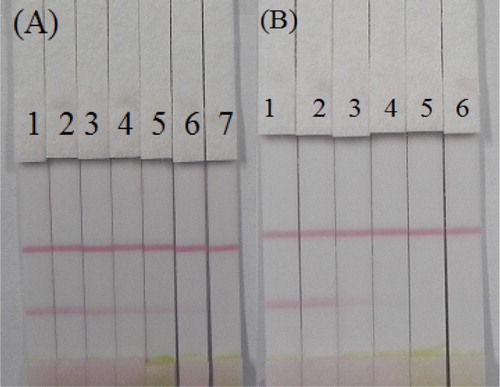
Figure 10. Determination of AC and TC with immunochromatographic strip test spiked in apple. (A) Acetamiprid (1 = 0 ng/mL, 2 = 0.5 ng/mL, 3 = 1 ng/mL, 4 = 2.5 ng/mL, 5 = 5 ng/mL, and 6 = 10 ng/mL). (B) Thiaclorid (1 = 0 ng/mL, 2 = 0.25 ng/mL, 3 = 0.5 ng/mL, 4 = 1 ng/mL, 5 = 2.5 ng/mL, and 6 = 5 ng/mL).