Figures & data
Figure 1. Experimental flowchart of the development of PV ELISA detection system.
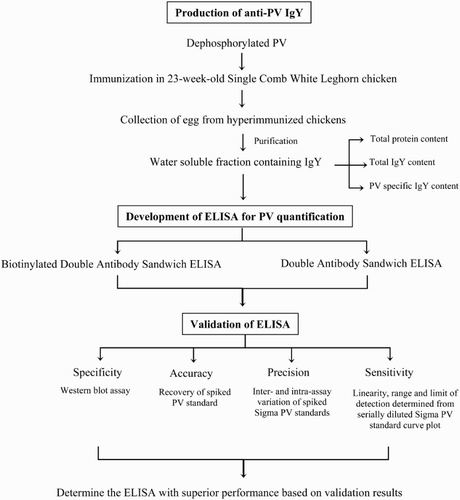
Figure 2. Diagram of the detection steps of DAS-ELISA (A); and biotinylated DAS-ELISA (B).
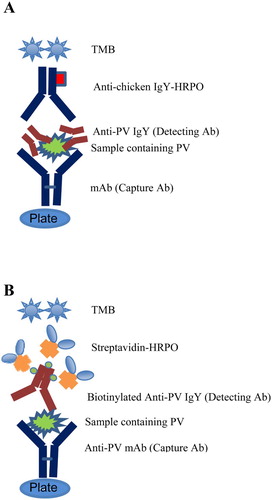
Figure 3. The anti-PV IgY antibody levels in the WSF of egg yolk (at 1:1000 dilution) measured by Indirect ELISA and expressed as absorbance at 405 nm. Values are the means of quadruple samples. Vertical bars indicate the standard deviation. X axis indicates the weeks of immunization. Arrows indicate immunization time points.
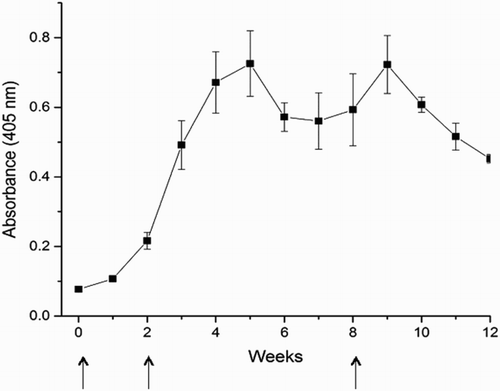
Table 1. Concentration of total IgY and specific IgY purified from the hyperimmunized and non-immunized egg yolks.
Figure 4. SDS-PAGE analysis of Sigma PV (A); Western blot of Sigma PV developed by anti-PV IgY as primary antibody (B); Western blot of Sigma PV developed by non-specific IgY as primary antibody (C, negative control). Lane 1: standard molecular marker; Lane 2: Sigma PV.
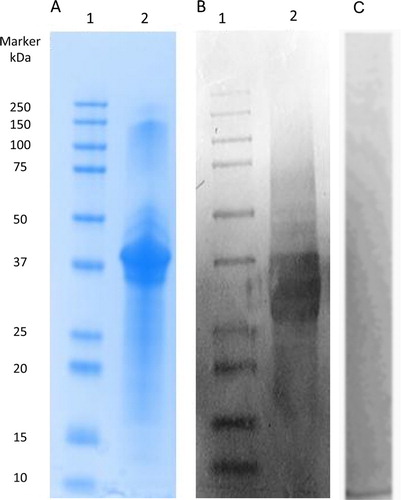
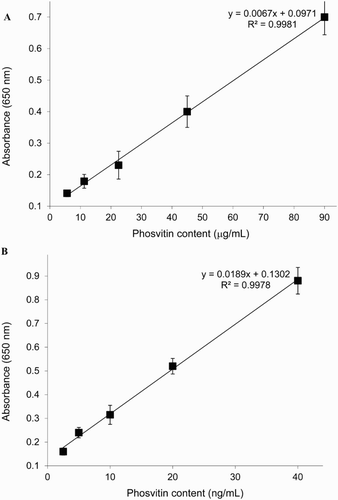
Figure 5. Standard curve for PV detection by DAS-ELISA (A); biotinylated DAS-ELISA (B).