Figures & data
Figure 1. Structures of dufulin and hapten for dufulin (DHS)
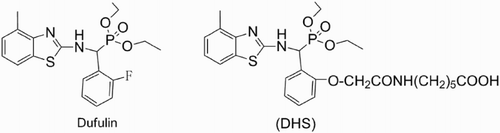
Figure 2. UV scanning spectrums of hapten–DHS (a), hapten–DHS–BSA conjugate (b), BSA (c), OVA (d) and hapten–DHS–OVA (e).
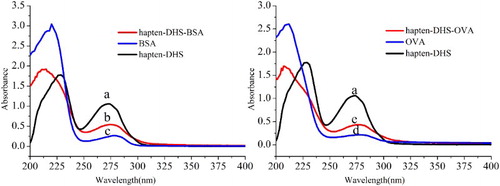
Table 1. Summary of titresa of antisera and competitive inhibition of DFL.
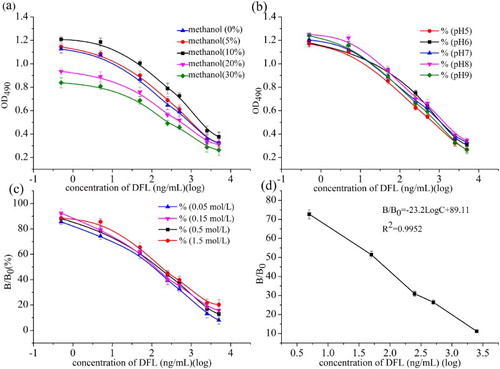
Figure 3. Optimization of parameters of ic-ELISA: (a) the influence of different contents of methanol in PBS buffer; (b) the influence of different pH value of assay buffer; (c) Effect of ionic strength in PBS buffer and (d) ELISA standard curve for DFL by indirect competitive assay.