Figures & data
Figure 1. (a) Competitive format structure of lateral flow assay. (b) The actual picture images of negative and positive test results of CG-LFA and FMs-LFA.
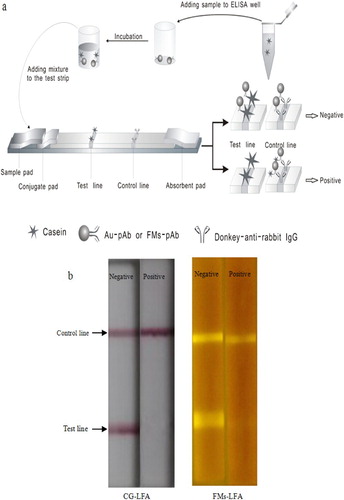
Figure 2. Standard curve of CG-LFA and FMs-LFA constructed by plotting B/B0 ratio against the concentration of casein. Error bars represent standard deviations from the means (n = 3).*p < .05 for the B/B0 ratio of CG-LFA versus that of FMs-LFA. #p < .05 for the B/B0 ratio of FMs-LFA versus that of CG-LFA.
Table 1. Three spiked concentrations (1000, 5000, and 10,000 ng/mL) of casein were analyzed for intra- and inter-assay recovery studies of the FMs-LFA and the CG-LFA.
Figure 3. Specificity study of FMs-LFA. Concentrations of casein, lysozyme, β-lactoglobulin, BSA, and OVA were 4.0 μg/mL (A), 7.0 μg/mL (B), and 9.0 μg/mL (C), respectively. and the 0.01 M of PBS buffer was used as the negative control. Error bars represent standard deviations from the means (n = 3).*p < .05 for the ST/SC ratio of casein versus that of the four other proteins and PBS.