Figures & data
Figure 1. Principle of the immunochromatographic strip detection: (A) composition of the lateral-flow immunochromatographic strip, and (B) strip detection with samples.
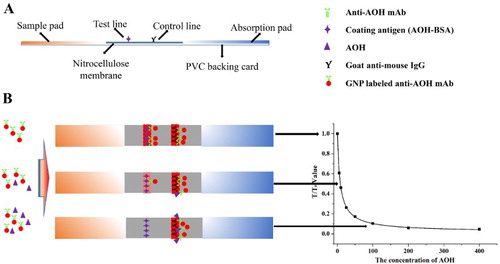
Figure 2. The UV–VIS spectra of coating antigens (AOH-BSA): (A) coating antigens conjugated by carbonyldimidazole method, and (B) coating antigens conjugated by formaldehyde condensation.
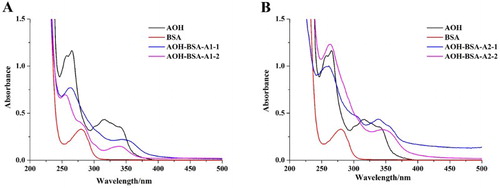
Figure 3. The Characterization of anti-AOH mAb: (A) The standard curve for anti-AOH mAb, and (B) the cross-reactivity for anti-AOH mAb.
Figure 4. Optimization of the immunochromatographic strip with coating antigen under different reaction ratio and concentration: (A) coating antigen A 1 with different concentration of 0.25 and 0.5 mg/mL, (B) coating antigen A 2 with different concentration of 0.25 and 0.5 mg/mL. Negative sample: the left with 0 ng/mL AOH in PBS; Positive sample: the right with 50 ng/mL AOH in PBS.
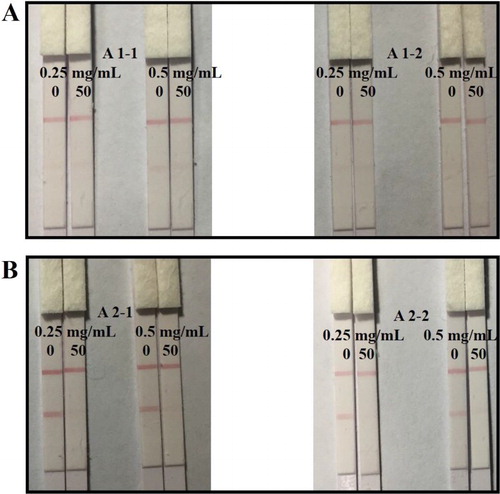
Figure 5. Optimization of the immunochromatographic strip with GNP-labeled mAb concentration: (1) With GNP-labeled mAb concentration of 8%, (2) with GNP-labeled mAb concentration of 12%, (3) with GNP-labeled mAb concentration of 16%, and (4) with GNP-labeled mAb concentration of 20%. Negative sample: the left with 0 ng/mL AOH in PBS; Positive sample: the right with 50 ng/mL AOH in PBS.
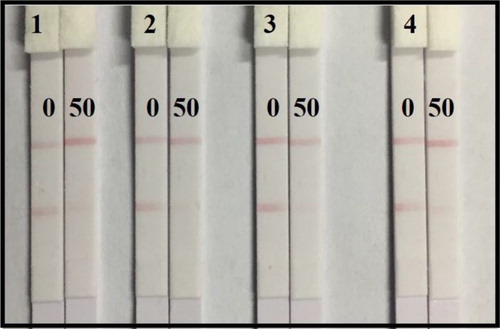
Figure 6. The sample analysis of immunochromatographic strip: (A) the AOH-spiked corn sample: (1) 0 ng/g; (2) 40 ng/g; (3) 80 ng/g; (4) 160 ng/g; (5) 320 ng/g; (6) 640 ng/g; (7) 1280 ng/g; (8) 2560 ng/g; (9) AME 5000 ng/g, (B) the AOH-spiked wheat sample: (1) 0 ng/g; (2) 40 ng/g; (3) 80 ng/g; (4) 160 ng/g; (5) 320 ng/g; (6) 640 ng/g; (7) 1280 ng/g; (8) 2560 ng/g; (9) AME 5000 ng/g, (C) the AOH-spiked apple juice sample: (1) 0 ng/g; (2) 5 ng/g; (3) 10 ng/g; (4) 25 ng/g; (5) 50 ng/g; (6) 100 ng/g; (7) 200 ng/g; (8) 400 ng/g; (9) AME 5000 ng/g, and (D) the AOH-spiked apple juice sample: (1) 0 ng/g; (2) 5 ng/g; (3) 10 ng/g; (4) 25 ng/g; (5) 50 ng/g; (6) 100 ng/g; (7) 200 ng/g; (8) 400 ng/g; (9) AME 5000 ng/g.
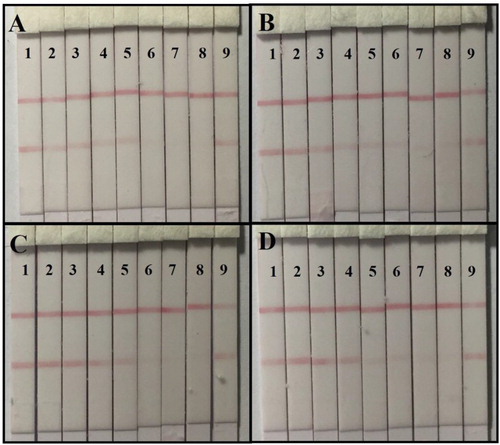
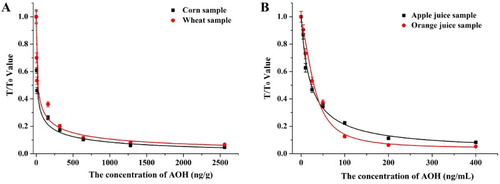
Figure 7. The standard curve of sample analysis by strip scan reader: (A) cereal samples, and (B) fruit juice samples.