Figures & data
Figure 1. The characterization of coating antigens (TeA-BSA). (A) The UV-Vis spectra of coating antigens; (B) The SDS-PAGE image of coating antigens: (1) BSA; (2) TeA-BSA A1; (3) TeA-BSA A2; (4) TeA-BSA A3.
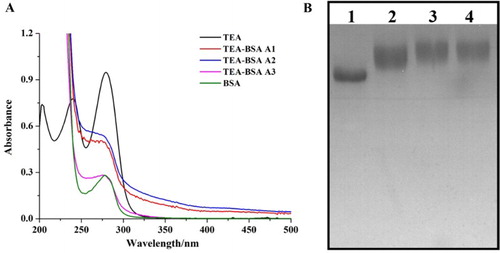
Figure 2. The characterization of anti-TeA mAb: (A) The standard curve for anti-TeA mAb; (B) The cross-reactivity for anti-TeA mAb.
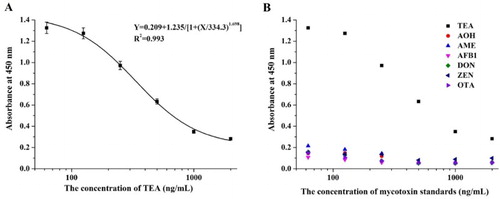
Figure 3. Optimization of lateral-flow ICA strip: (A) optimization of coating antigen with different synthesized methods; (B) Optimization of coating antigen A2 with different concentration on T line; (C) Optimization of suspension buffer with different surfactant reagents: (1) Basic, (2) PVP, (3) PEG, (4) PVA, (5) BSA, (6) casein, (7) sucrose, (8) trehalose, (9) sorbitol, (10) mannitol, (11) Tween-20, (12) Brij-35, (13) Triton X-100 and (14) On-870.
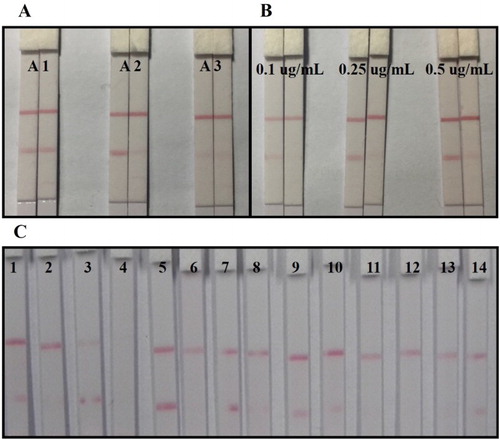
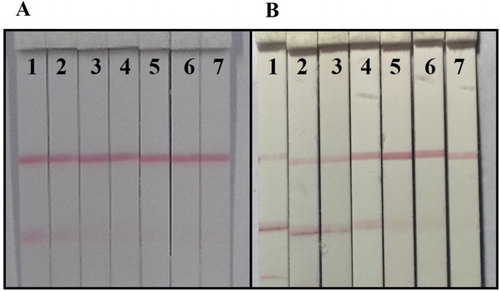
Figure 4. Sensitivity analysis of lateral-flow ICA strip. (A) Sensitivity analysis by naked eyes; (1) 0 ng/mL; (2) 100 ng/mL; (3) 200 ng/mL; (4) 400 ng/mL; (5) 800 ng/mL; (6) 1600 ng/mL; (7) 3200 ng/mL; (B) Sensitivity analysis by strip scan reader.
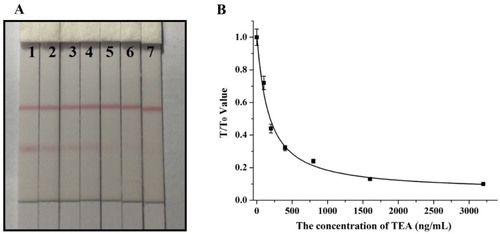
Figure 5. The sample test by lateral-flow ICA strip. (A) Wheat sample: (1) 0 ng/g; (2) 800 ng/g; (3) 1600 ng/g; (4) 3200 ng/g; (5) 6400 ng/g; (6) 12,800 ng/g; (7) 25,600 ng/g; (B) Apple juice sample: (1) 0 ng/mL; (2) 200 ng/mL; (3) 400 ng/mL; (4) 800 ng/mL; (5) 1600 ng/mL; (6) 3200 ng/mL; (7) 6400 ng/mL.