Figures & data
Figure 1. NAT showed remarkable effects on metabolism homeostasis and organism immunity (A) body weight, (B) food intake changes, (C) fecal water content (%), (D) thymus index and (E) Spleen index. Data are presented as mean ± SEM. #P < .05, ##P < .01 indicates significant difference from the control group; *P < .05, **P < .01 indicates significant difference from the AB group.
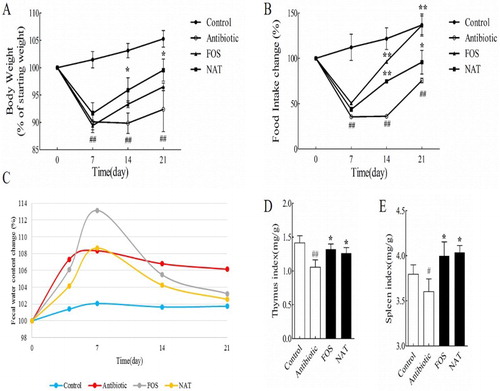
Figure 2. NAT significantly decreased the intestinal inflammation induced by overuse of antibiotics. (A) The length of the colon and (B) the ileocecal valve index. The effects of NAT on the mRNA expression of (C) TNF-α, (D) IL-1β and (E) IL-10, (F) IFN-γ, (G) IL-4 concentration and (H) the ratio of IFN-γ to IL-4 in the intestinal tissue. Data are presented as mean ± SEM. #P < .01, #P < .05 indicates significant difference from the control group; *P < .05, **P < .01 indicates significant difference from the AB group. β-Actin is the loading control.
Figure 3. The relative mRNA expression levels of the AMPs and tight junction proteins in the small intestine. The relative mRNA expression of (A) sPLA2, and (B) Ang4 in the small intestine. The relative mRNA expression of (C) E-cadherin, (D) Occludin, (E) ZO-1 and (F) Muc2 were detected by qRT-PCR. Data are presented as mean ± SEM. ##P < .01, #P < .05 indicates significant difference from the control group; *P < .05, **P < .01 indicates significant difference from the AB group. β-Actin is the loading control.
Figure 4. Fecal concentrations of SCFAs in mice. Levels of (A) acetic acid (B) propionic acid (C) butyric acid (D) pentanoate acid and (E) total SCFAs are shown.
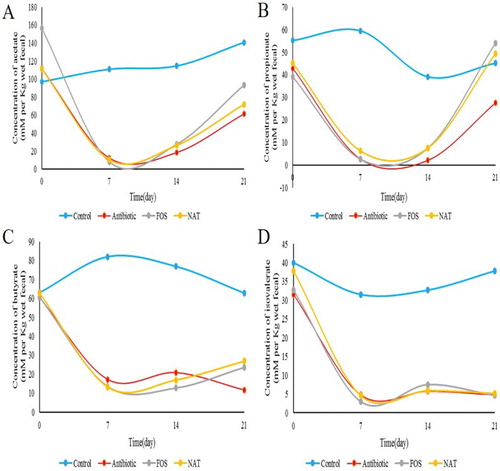
Figure 5. NAT restored antibiotic-induced dysbiosis of gut microbiota. (A) Principal component analysis (PCA) was performed using the Canoco for Windows 4.5 based on DGGE profiles from feces samples. (B) UPGMA cluster analysis of the DGGE profiles. (C) Relative abundances of the Firmicutes and (D) Bacteroidetes phyla in antibiotic-treated mice. (E) The corresponding ratio of the relative abundances of Firmicutes to Bacteroidetes at the phylum level. Data are presented as mean ± SEM. ##P < .01, #P < .05 indicates significant difference from the control group; *P < .05, **P < .01 indicates significant difference from the AB group.
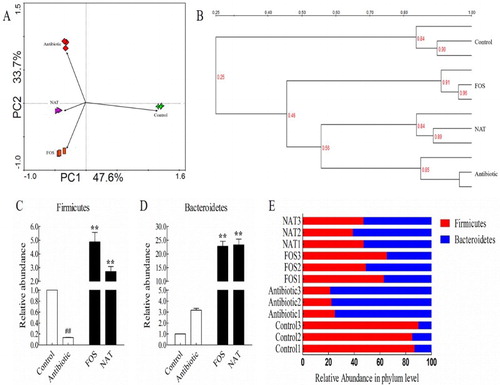
Figure 6. NAT increased microbial diversity and the relative abundance of probiotics in the mice gut microbiome. (A) Total bacteria load, (B) Shannon index and (C) Richness values, (D) Evenness values. The relative abundance of (E) Bifidobacterium, (F) Lactobacillus, (G) Clostridium and (H) Prevotella. Data are presented as mean ± SEM. ##P < .01, #P < .05 indicates significant difference from the control group; *P < .05, **P < .01 indicates significant difference from the AB group.