Figures & data
Figure 1. The detection procedure and principle of the developed FMIC for quinoxalines detection.
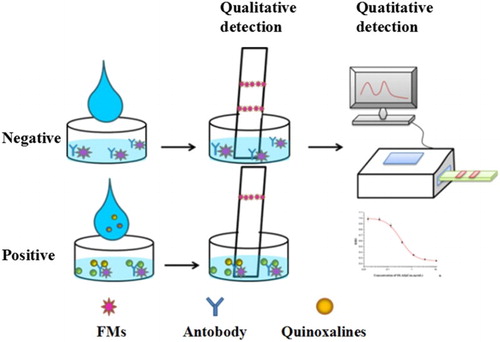
Figure 2. The influence of color and diameter of FMs in the development of FMIC. (A) Visual signals of red (580/605), green (505/515), and blue (365/415) FMs on the FMIC under the ultraviolet lamp. (B) Visual signals of red (580/605) FMs with different diameters on the FMIC under the ultraviolet lamp, and the inset photograph is the FMs with different diameters in visible light.
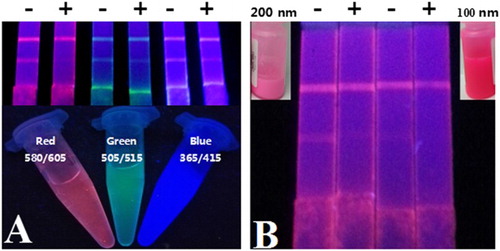
Figure 3. The optimization of parameters in the process of detection probe preparation. (A) The volume of 100-fold diluted antibody, (B) the buffer system, and (C) the concentration of BSA in antibody dilution.
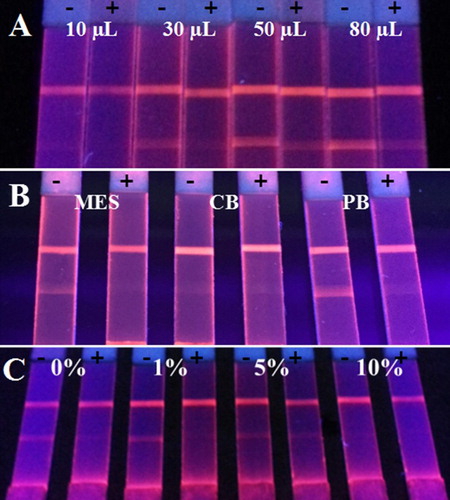
Figure 4. The optimization of FMIC test strip parameters. (A) The sample pads, (B) the amount of FMs-mAb probes, (C) the incubation time of the sample, and (D) the detection time.
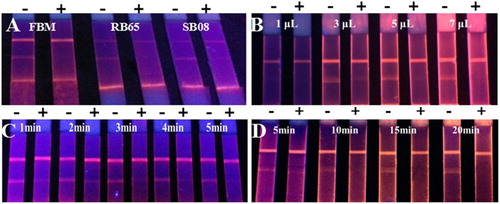
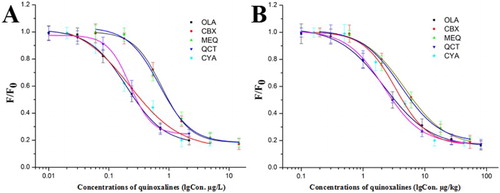
Figure 5. The standard curves of FMIC for the five quinoxalines in the environmental water (A) and animal foodstuffs (B), respectively.