Figures & data
Figure 1. Cytotoxicity of CPF on QSG7701 cells. Cell viability of QSG7701 cells treated with 25, 50, 100, 200, 400 and 800 μM CPF for 24 and 48 h. The cell viability is expressed as the mean values (±SD) of three independent experiments. *p < .05 and **p < .01 represent significant differences relative to negative control.
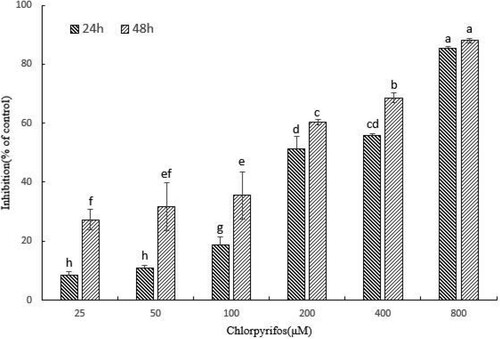
Table 1. The half maximal inhibitory concentration (IC50) of QSG7701 cells exposed to CPF.
Figure 2. CPF-induced apoptosis in QSG7701 cells. Representative flow cytometric analysis conducted for cells stained with Anexin V-PI following treatment with 50, 100, 200, 400 μM CPF and 0.1% DMSO used as a control for 24 h (A). The lower right panel shows the early apoptotic cells and the upper right panel shows the late apoptotic cells or cells undergoing necrosis. Quantitative data are shown in the right panel (B). The data represent the means ± SD values of three experiments in triplicate. *p ≤ .05 and **p ≤ .01 vs. the negative control.
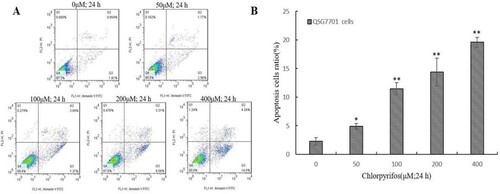
Figure 3. Decrease of MMP in CPF-treated QSG7701 cells. QSG7701 cells were pre-treated with 0, 50, 100, 200 and 400 μM of CPF for 6 h and then loaded with Rh-123. The quantification of Rh-123 accumulation in mitochondria (green fluorescence) was analysed by flow microscopy (200×) (A). Data were considered significant at **p < .01 vs. the negative control (B). Data are the means ± SD of three independent experiments and expressed as the percentage of the control cells.
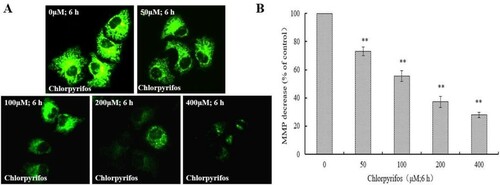
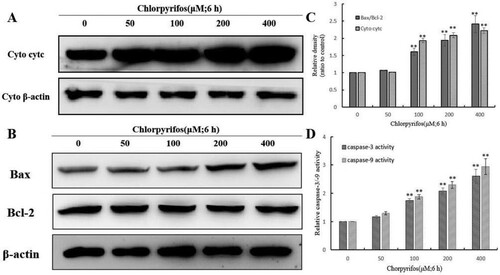
Figure 4. Effect of CPF on the expression of apoptosis-related proteins in QSG7701 cells. Cells were fractionized following treatment with 50, 100, 200, 400 μM CPF for 6 h and cyt c release was detected (A). Cyto denote cytosolic fractions. Whole cell extracts were prepared for cells treated with 50, 100, 200 and 400 μM CPF for 6 h and the expressions of pro-apoptotic proteins as Bax and anti-apoptotic proteins as Bcl-2 were detected (B). β-actin was used as an equal loading control. The densitometric analysis results are shown in the right panel (C). Effect of CPF on the activation of caspase-3/-9 in QSG7701 cells (D). Data are represented as means ± SD from three independent experiments. *p ≤ .05 and **p < .01 vs. the negative control.