Figures & data
Figure 1. Effects of the inoculation of antigen on the production of specific antibodies. The levels of antibody (IgY) anti-human IgG from serum collected 7 days after the third (III), fifth (V), and seventh inoculation (VII) from animals without inoculation (CG) and inoculated through intramuscular (IM), intradermal (ID), or subcutaneous routes (SC) were determined by indirect enzyme-linked immunosorbent assay (ELISA). The data are shown as mean and standard deviation. #Significant difference between the CG and ID and SC groups (Dunn, P < .007). *Significant difference between CG and IM, ID, and SC groups (Bonferroni, P < .0001).
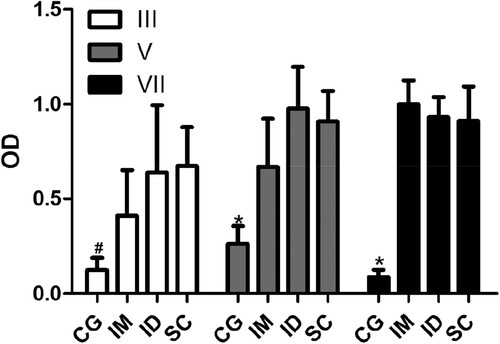
Figure 2. Influence of route of inoculation of antigen on the avidity index of specific antibodies. The avidity index (AI) was determined by indirect ELISA using the relationship between the serum sample treated with chaotrope (MgCl2 2 M) and the same sample treated with saline. Serum samples collected 7 days after the third (III), fifth (V), and seventh (VII) inoculation of the antigen were analysed from animals without inoculation or inoculated through intramuscular (IM), intradermal (ID), or subcutaneous routes (SC). The data are shown as mean and standard deviation. *Significant difference between samples collected after the third, fifth, and seventh inoculations (IM, Bonferroni, P = .003; ID, Bonferroni, P < .0001). #Significant difference between samples collected after the third and seventh inoculations (Bonferroni, P = .0025).
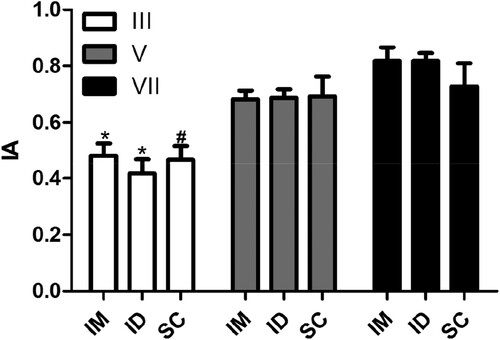
Figure 3. Antigen dose effect on the production of specific antibodies. The levels of serum antibody (IgY) anti-human IgG were determined by indirect ELISA. Serum samples collected 7 days after the fifth (V) and seventh (VII) inoculation of animals without inoculation (CG) or inoculated with 2 µg (2 µg), 20 µg (20 µg), and 200 µg (200 µg) of human IgG were analysed. The data are shown as mean and standard deviation. #Significant difference between CG, 20 µg, and 200 µg groups (Bonferroni, P < .0001). *Significant difference between the CG, 2, 20, and 200 µg groups (V, Dunn, P = .0045; VII, Bonferroni, P < 0.0001). &Significant difference between the 2 and 200 µg groups (Bonferroni = P < .0001).
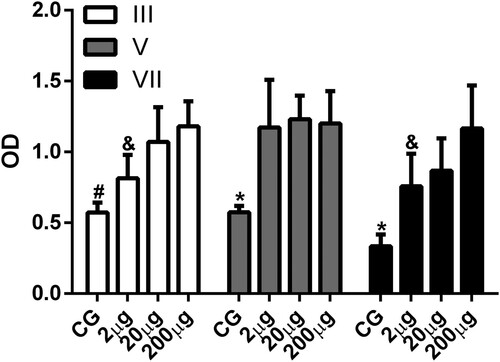
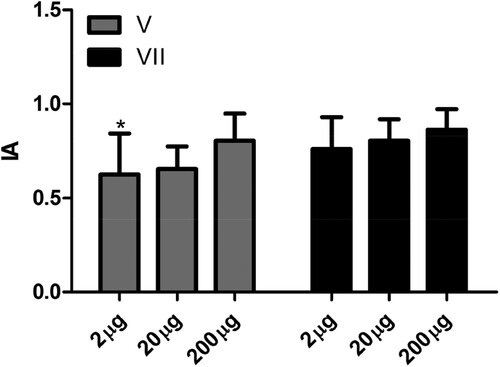
Figure 4. Influence of dose of antigen on the avidity index of specific antibodies. The avidity index (AI) was determined by indirect ELISA using the relationship between the serum sample treated with chaotrope (MgCl2 2 m) and the same sample treated with saline. Serum samples collected 7 days after the fifth (V) and seventh (VII) inoculation of the antigen were analysed in the animals in the control group (CG) without inoculation and inoculated with 2 µg (2 µg), 20 µg (20 µg), and 200 µg (200 µg) of human IgG. The data are shown as medium and standard deviation. *Significant difference between the fifth and seventh inoculation in animals from the 2 µg group (Paired t-test P = .0064).