Figures & data
Figure 1. Chemical structure of ochratoxin A.
Figure 2. The UV spectra characterization for OTA-CDI-BSA, OTA, and BSA.
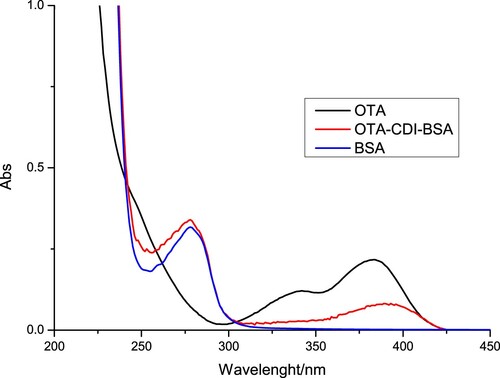
Figure 3. The UV spectra characterization for OTA-EDC-KLH, OTA, and KLH.
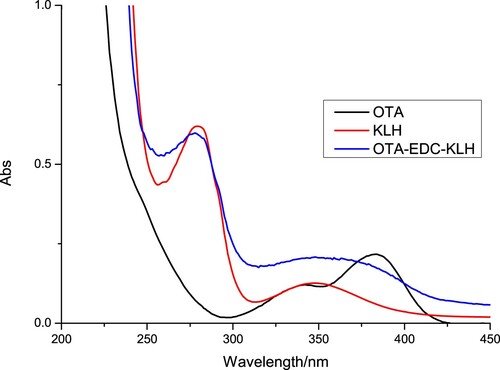
Figure 4. Illustration of typical strip test results. If the sample is negative (A), a positive result could be indicated only if the control line appears (B), and if the control and test line does not appears (invalid) (C).
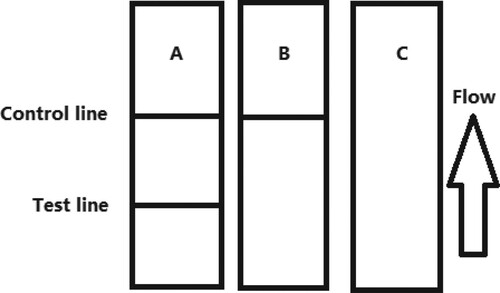
Figure 5. Result of using 14 kinds of surfactants. 1 = suspension buffer, 2 = PVP, 3 = PEF, 4 = PVA, 5 = BSA, 6 = Casein, 7 = Sucrose, 8 = Trehalose, 9 = Sorbitol, 10 = Mannitol, 11 = tween-20, 12 = Brij-35, 13 = Triton X-100, and 14 = On-870. a = negative (0 ng/mL). b = positive (50 ng/mL).
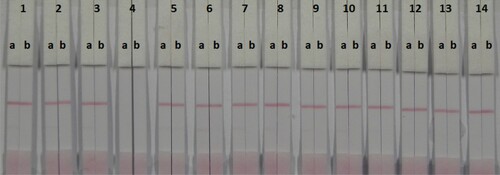
Figure 6. Colloidal gold immunochromatographic for OTA by using six kinds of surfactant. a = negative (0 ng/mL). b = positive (50 ng/mL).
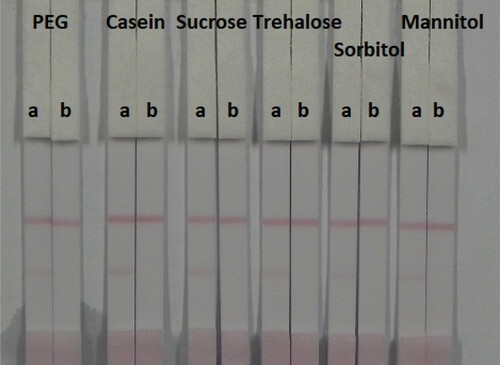
Figure 7. Optimization of the immunochromatographic strip. Concentration of coating antigen (A) 1 mg/mL; (B) 2 mg/mL. The dosage of the mAb that add in GNP: (1) 8 µg/L; (2) 4 µg/L. The standard concentration: (a) 0 ng/mL and (b) 25 ng/mL.
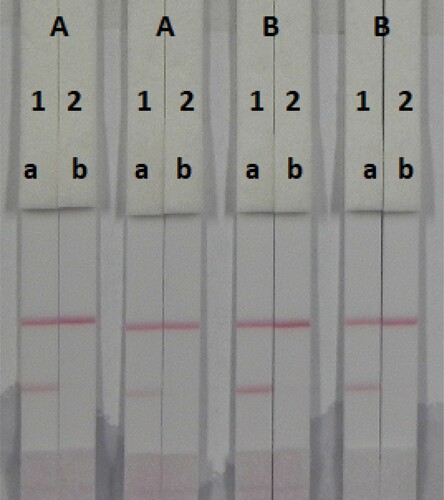
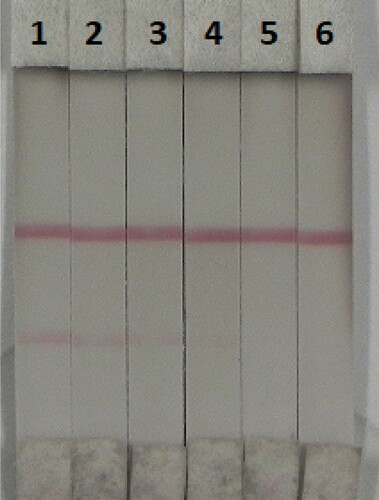
Figure 8. Colloidal gold immunochromatography assay for OTA in 0.01 M PBS (pH 7.4). OTA concentration: 1 = 0 ng/mL; 2 = 0.5 ng/mL; 3 = 1 ng/mL; 4 = 2.5 ng/mL; 5 = 5 ng/mL; and 6 = 10 ng/mL.
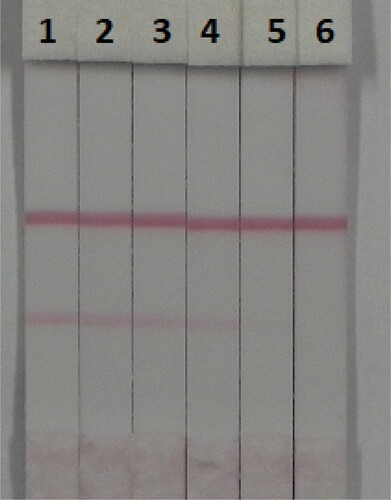
Figure 9. Result of OTA detection with colloidal gold immunochromatographic strip assay spiked in red wine (n = 6). 1 = 0 ppb, 2 = 0.5 ppb, 3 = 1 ppb, 4 = 2.5 ppb, 5 = 5 ppb, and 6 = 10 ppb.