Figures & data
Table 1. Cross-reactivity of PEF-mAb with different FQ compounds.
Table 2. Recovery results of nine FQ compounds from fortified chicken muscle.
Figure 1. The schematic diagram of PEF- immunogen synthesis.
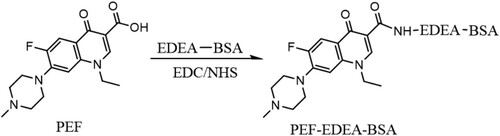
Figure 2. Illustration of typical strip test results. (A) negative test, (B) positive test and (C and D) invalid tests.
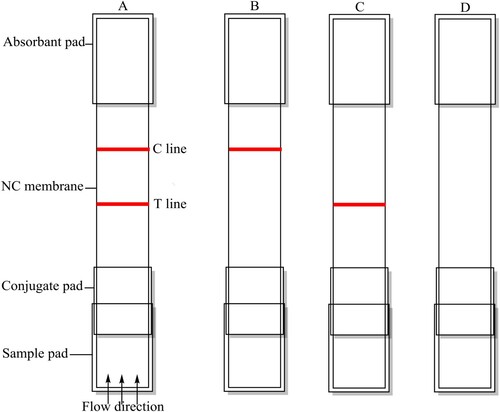
Figure 3. Characterization of PEF-EDEA-BSA conjugate by UV spectrophotometric.
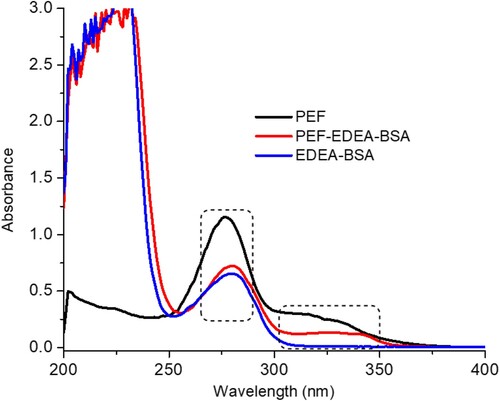
Figure 4. Effects of (a) pH variation, (b) salt concentration, (c) methanol concentration and (d) acetonitrile (ACN) concentration on ic-ELISA performance.
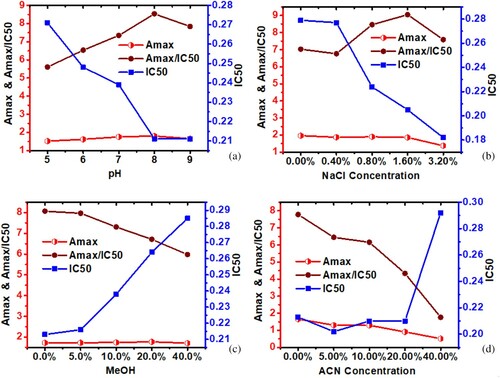
Figure 5. The PEF Inhibition standard curve under optimised conditions (pH 8.0, 1.6%NaCl, 5% MeOH and, 0.0% ACN in PBS assay).
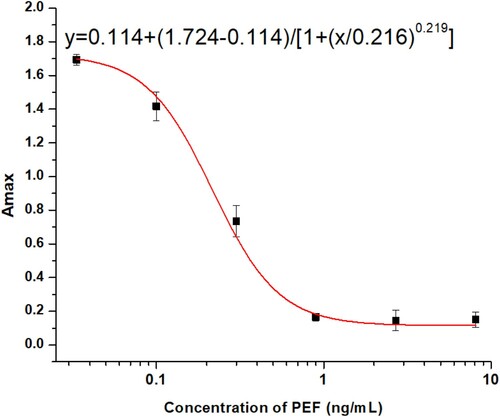
Figure 6. Lateral flow test strips of nine FQ compounds in 0.01 M PBS assay (A1) PEF, (A2) NOR, (A3) CIPRO, (A4) ENO, (A5) FLE, (A6) PF, (A7) OFL, (A8) SARA and (A9) LOM. Various analyte concentrations; (1 = 0, 2 = 0.1, 3 = 0.25, 4 = 0.5, 5 = 1.0, 6 = 2.5, 7 = 5, 8 = 10, 9 = 25, and 10 = 50 ng/mL). *The visual cut off value.
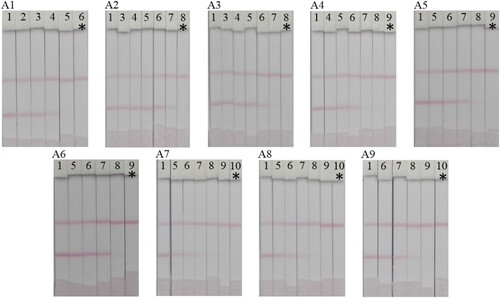
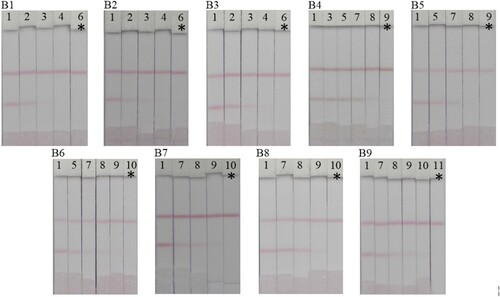
Figure 7. Detection of nine FQ compounds in chicken muscle using Lateral flow test strips. (B1) PEF, (B2) NOR, (B3) CIPRO, (B4) ENO, (B5) FLE, (B6) PF, (B7) OFL, (B8) SARA and (B9) LOM. Spiked amounts; (1 = 0, 2 = 0.625, 3 = 1.25, 4 = 2.5, 5 = 3.125, 6 = 5, 7 = 6.25, 8 = 12.5, 9 = 25, 10 = 50 and 11 = 100 µg/kg). *The visual cut off value.