Figures & data
Figure 1. The synthesis of CLP-hapten.
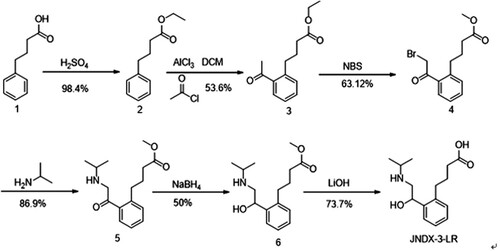
Figure 2. LC-MS analysis of CLP-hapten.
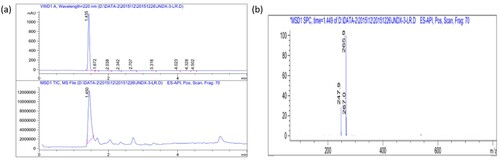
Figure 3. Polyacrylamide gel electrophoresis image of immunogen (a) (1 = BSA; 2/3 = MCLP-hapten : MBSA (80:1;120:1)) and coating antigens (b) of CLP (1 = MCLP-hapten: MOVA (30:1); 2 = OVA).
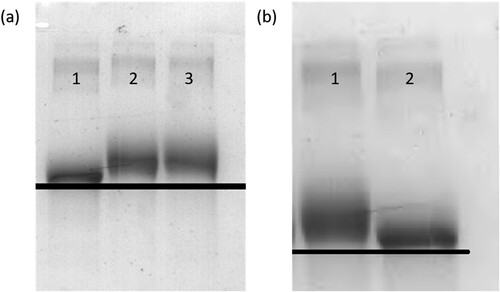
Figure 4. The standard curve of developed Ic-ELISA method. IC50 of 4G1 was 0.095 ng/mL, LOD was 0.013 ng/mL and the linear range of detection was from 0.0258 to 0.356 ng/mL.
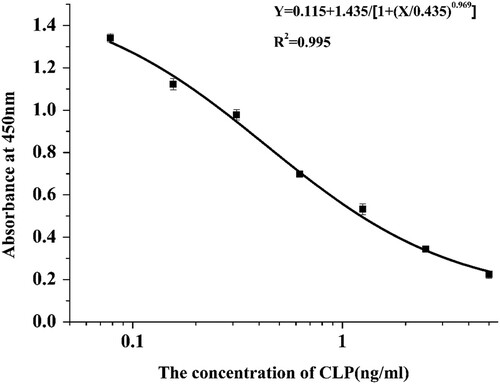
Table 1. Cross-reaction results of McAb 4G1.
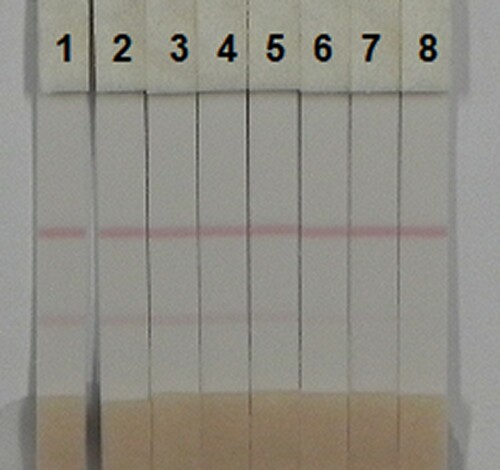
Figure 5. Image of detection by clorprenaline immunochromatographic strip in urine. A series of urine samples spiked clorprenaline were subjected to the immunochromatographic strip test. 1 = 0 ng/mL, 2 = 0.1 ng/mL, 3= 0.25 ng/mL, 4 = 0.5 ng/mL, 5= 1 ng/mL, 6 = 2.5 ng/mL, 7 = 0.5 ng/mL, 8 = 10 ng/mL. Cut-off value was 10 ng/mL.